
SUMMARY
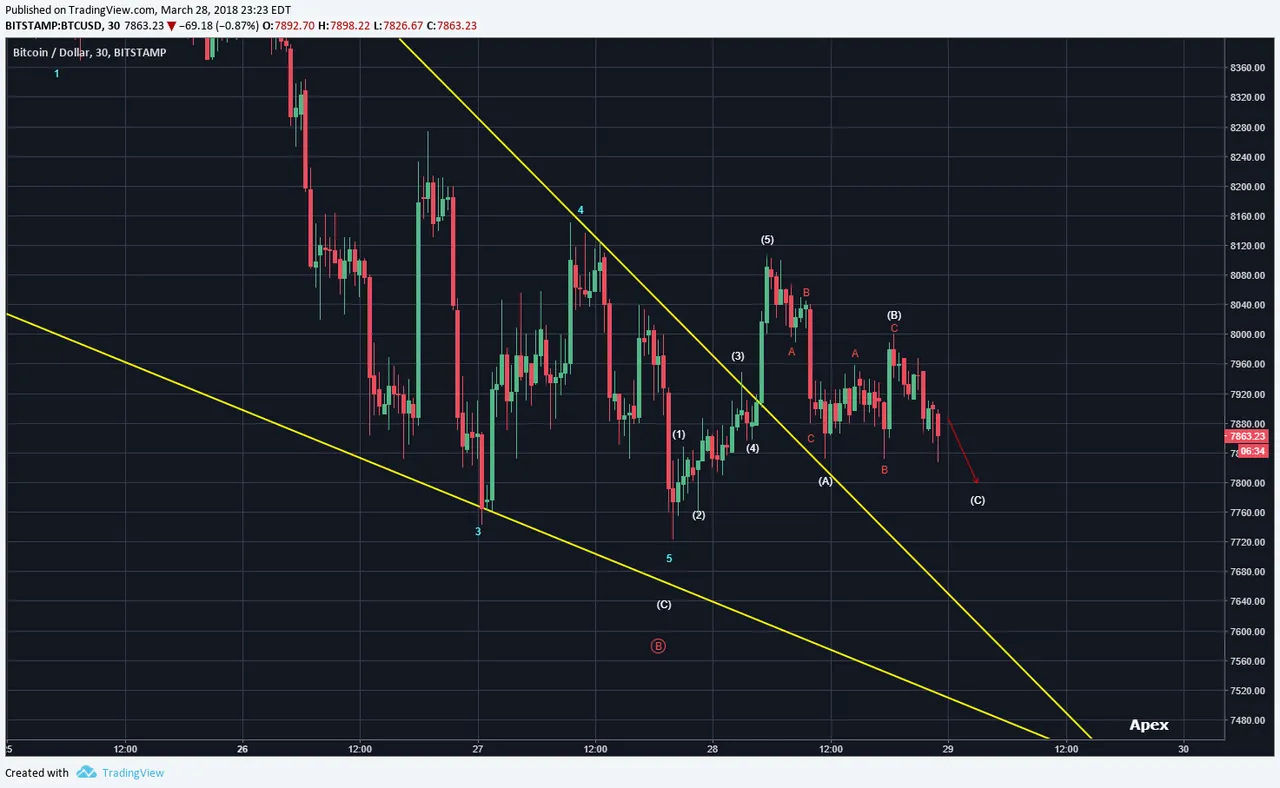
Bitcoin's (BTC) price action today basically went sideways. Per below chart, it's either putting in the finishing touches of the white abc or another pattern needs to be assessed.
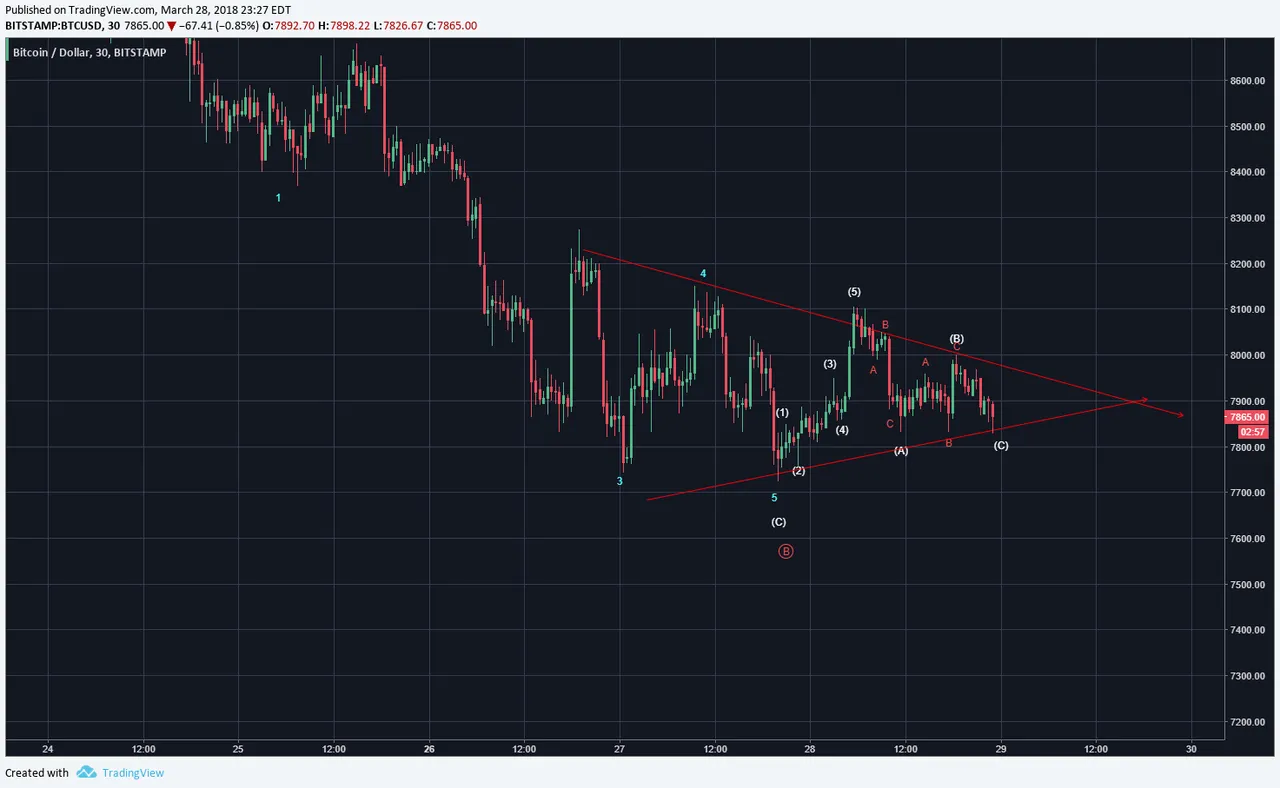
This pattern looks quite fitting given the sideways action. It could be labeled as complex but the symmetrical triangle pattern provides as much sideways action but the price is moving very well to the contracting lines. There should be one more smaller up and a down to bring price closer to the apex.
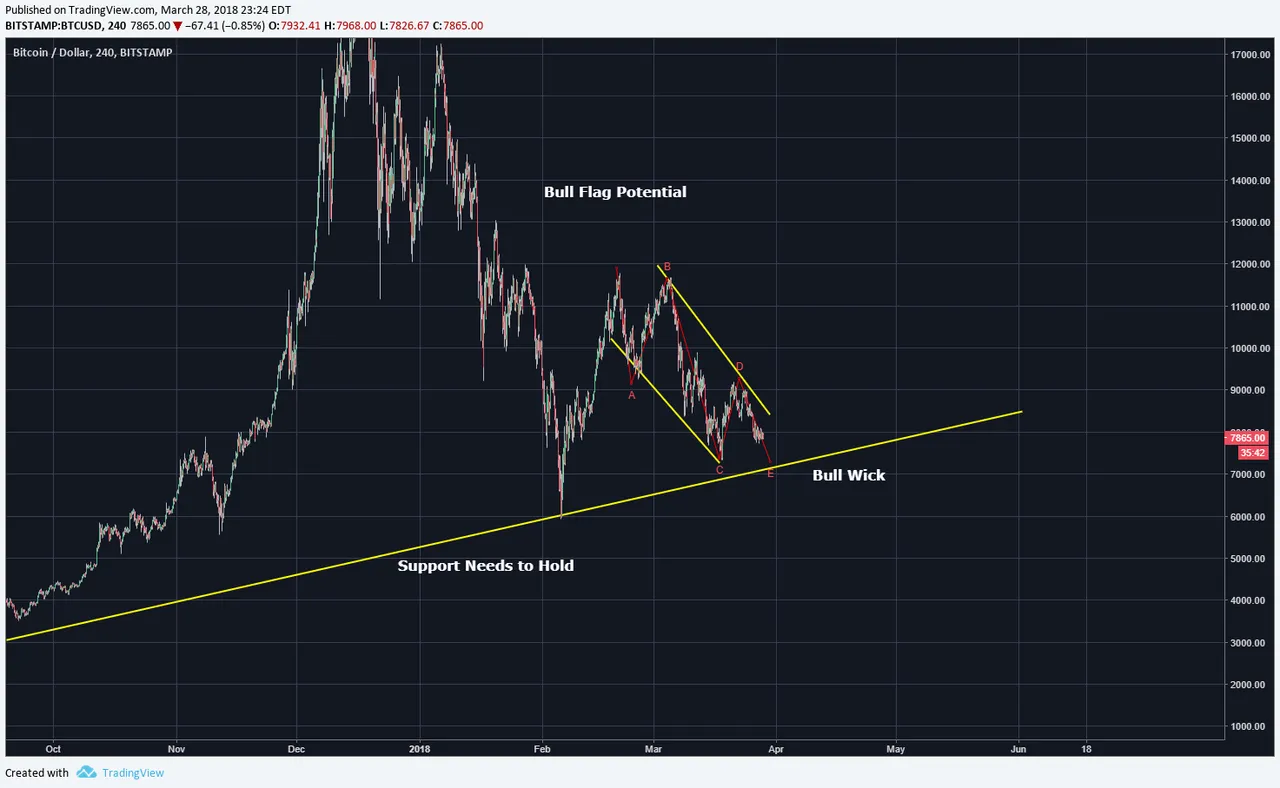
The longer term bull flag pattern remains valid and in progress. The final C would touch or briefly pierce the longer term support line.
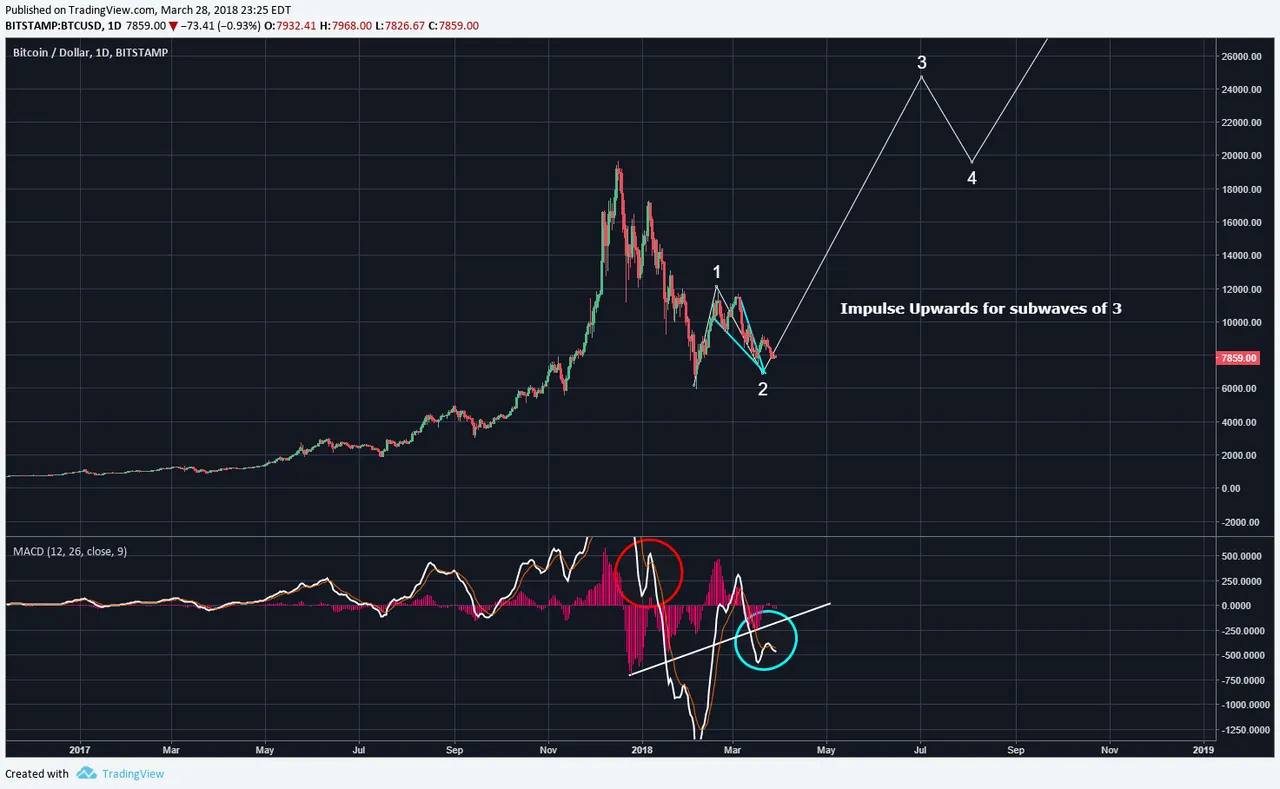
The MACD is or price has not yet invalidated the wave 1 and 2 relationship. Let's see how the overnight price activity pans out.
Legal Disclaimer: I am not a financial advisor nor is any content in this article presented as financial advice. The information provided in this blog post and any other posts that I make and any accompanying material is for informational purposes only. It should not be considered financial or investment advice of any kind. One should consult with a financial or investment professional to determine what may be best for your individual needs. Plain English: This is only my opinion, make of it what you wish. What does this mean? It means it's not advice nor recommendation to either buy or sell anything! It's only meant for use as informative or entertainment purposes.
Please consider reviewing these Tutorials on:
Elliott Wave Counting Tutorial #1
Elliott Wave Counting Tutorial #2
Elliott Wave Counting Tutorial #3
Laddering and Buy/Sell Setups.
Laddering Example with EOS
Tutorial on the use of Fibonacci & Elliott Waves
@haejin's Trading Nuggets
Essay: Is Technical Analysis a Quantum Event?
Follow me on Twitter for Real Time Alerts!!
Follow me on StockTwits for UpDates!!
--
--

