
SUMMARY
Chart Pattern Recognition is a skill that only gets better with repetitious practice. I know of no other way. Practice, practice and practice! By now you should have BOTH of the recommended books. If not yet, please consider investing in these and as full disclosure, I receive NOTHING for recommending them.
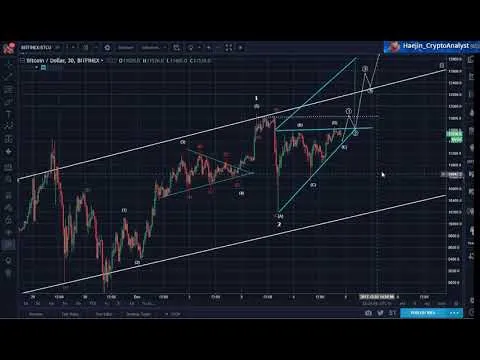
The below chart shows a Bullish Ascending Right Triangle as shown by the blue lines. The minimum price target is $12,776 and an impulse set of waves should take the price there. This is the minimum so will likely be well exceeded! I've also labeled the price waves within the ascending right triangle as a,b,c,d,e and so one more dip could be possible, but not required.

Please consider reviewing these Tutorials on:
Elliott Wave Counting Tutorial #1
Elliott Wave Counting Tutorial #2
Elliott Wave Counting Tutorial #3
Laddering and Buy/Sell Setups.
Laddering Example with EOS
Tutorial on the use of Fibonacci & Elliott Waves
These Technical Analysis Books: Elliott Wave Priniciple & Technical Analysis of Stock Trends are highly recommended
@haejin's Trading Nuggets
Essay: Is Technical Analysis a Quantum Event?
Follow me on Twitter for Real Time Alerts!!
--

If this blog post has entertained or helped you to profit, please follow, upvote, resteem and/or consider buying me a beer:
BTS Wallet - haejin1970
BTC Wallet - 1HMFpq4tC7a2acpjD45hCT4WqPNHXcqpof
ETH Wallet - 0x1Ab87962dD59BBfFe33819772C950F0B38554030
LTC Wallet - LecCNCzkt4vjVq2i3bgYiebmr9GbYo6FQf

Legal Mumbo Jumbo: This is only my opinion, make of it what you wish. What does this mean? It means it's not advice nor recommendation to either buy or sell anything! It's only meant for use as informative or entertainment purposes.**