It is always best to be aware of all of the possibilities. With that in mind I have been looking at other indicators and historical info on BTC to try and see what the alternatives are.
The 1st which I have seen another Analyst Goldbug1, put forward and which stands up strongly is that the 150 EMA has acted as a support for BTC since October 2015.During this time there have been numerous corrections, including June and August 2017 which went as deep as the current correction. Currently the 150 EMA support is sitting at $10,000.00.
The 2nd is that there is a massive 'Hidden Divergence' which is very Bullish. This is where the price action shows Higher lows and the MACD shows Lower lows. See the second chart. This is a very Bullish indicator.
Worst case scenario is my EW count which I have posted previously and which still stands.
As always be aware of the possibilities and do your own due diligence before making any investment decisions.
[url=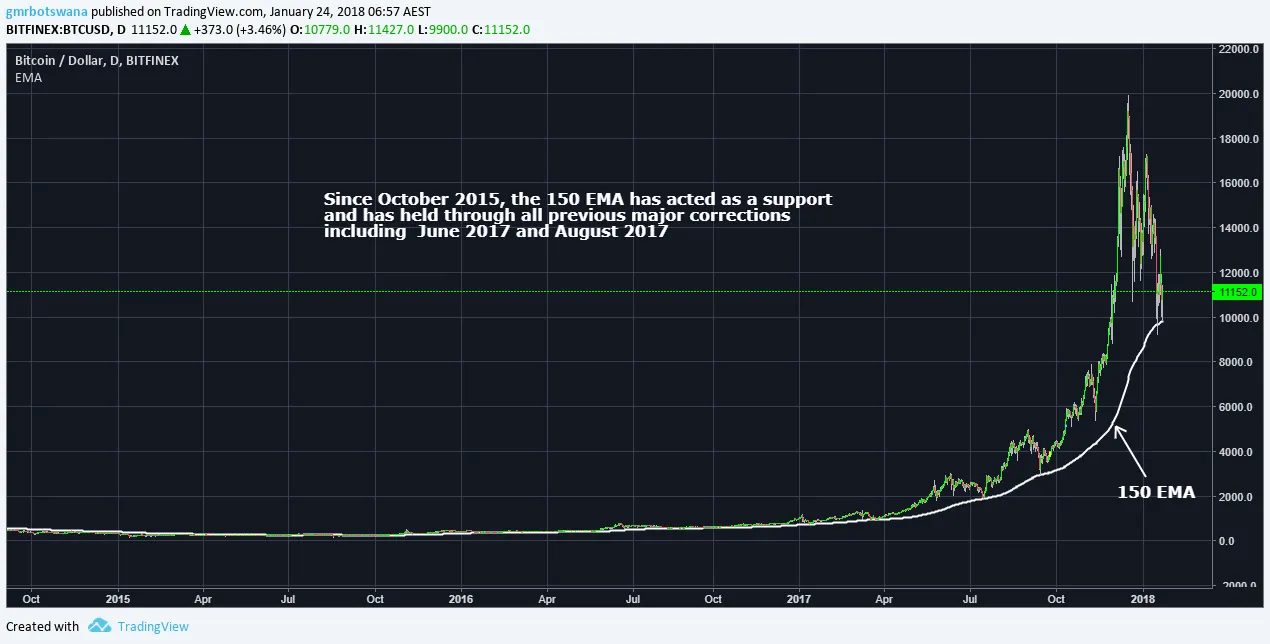
[url=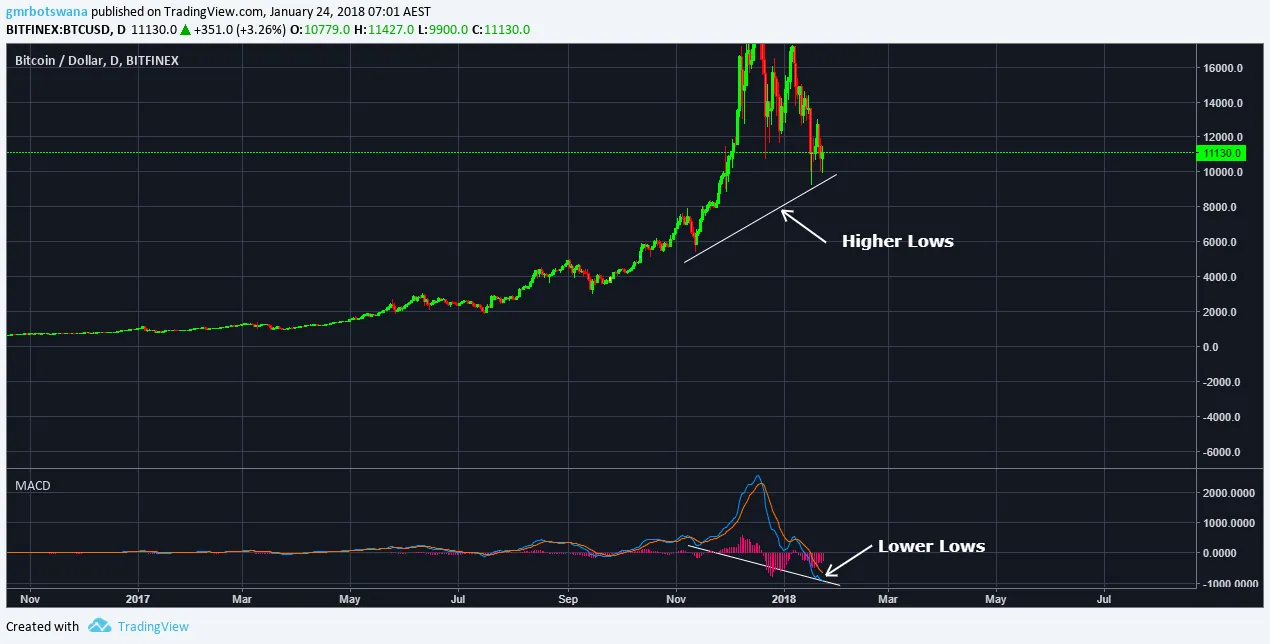
This chart is for my personal trading and entertainment purposes only. Please do your own Due Diligence before investing in any token and never invest more than you can afford to lose.
Please Up Vote, Re Steem and follow if you find this information helpful or entertaining.