Price has been moving predictably up against yesterday's triangle, not willing to break out of it yet.
From post yesterday, a daily chart
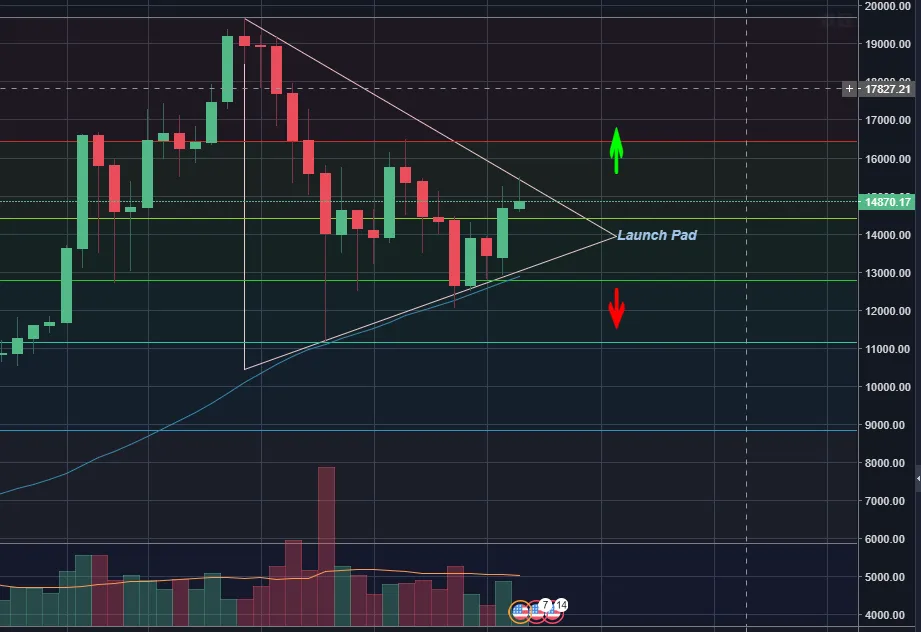
Triangle is clearly acting as price roof for now.
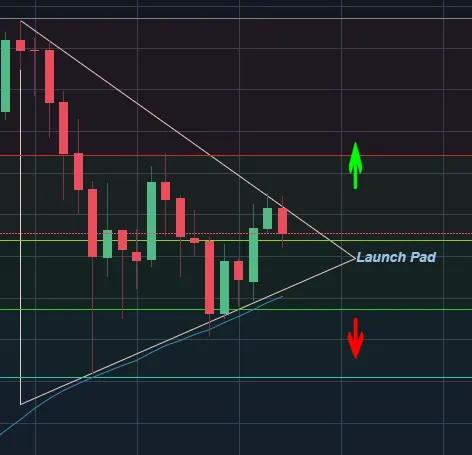
How it looks today, hourly chart
The price is currently testing the second fibonacci retracement level, which for now is acting as support. The triangle being the stronger indicator, my guess is that we'll fall below this fibonacci level and retest the 50day moving average, which aligns itself perfectly with the lower part of the triangle, as seen on the chart:
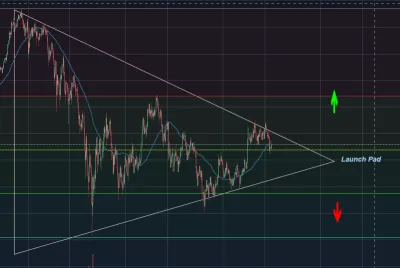
Today, daily chart
Nothing is decided just yet. There is still more room in triangle. Keep in mind that the 50day support gets weaker every time it has to act as such.
In other words, the nail biting continues.