The Bitcoin ETFs were approved back in January 2024. This allowed more institutional investors to join the Bitcoin train. It was a long overdue decision by the SEC and it took a court decision to basically force the SEC to approve Bitcoin ETFs.
For those unaware Grayscale probably has the highest contribution for the approval of the Bitcoin ETFs. Grayscale started their Bitcoin trust way back in 2013. This trust was basically the only way for institutions to get some Bitcoin exposure. The way it worked is that the trust was sort of proxy for Bitcoin, but it was not directly convertible to Bitcoin. Because of this the Grayscale trust shares were often trading at different prices then Bitcoin. Grayscale grew over time and before the approval of the ETFs it had more than 600k Bitcoins or more than 3% of the supply.
Grayscale wanted to convert the trust into ETF for a long time. The SEC was not allowing this, Grayscale sued the SEC and the court decided that the SEC needed to approve Grayscale application for ETF. The decision of the court was back in August 2023 and in January 2024 the SEC approved the Bitcoin ETFs.
With this short history of the Bitcoin ETFs approval process let’s take a look at the data since that happened.

Here we will be looking at:
- Daily ETF Flows
- ETF Flows Breakdown by Fund
- Cumulative ETF Inflows
- ETF Holdings by Fund
- Top ETFs
- Top Holders Change
The data presented here is mostly gathered from Dune Analytics.
Daily BTC ETFs Inflow
Here is the chart for the cumulative daily inflows.
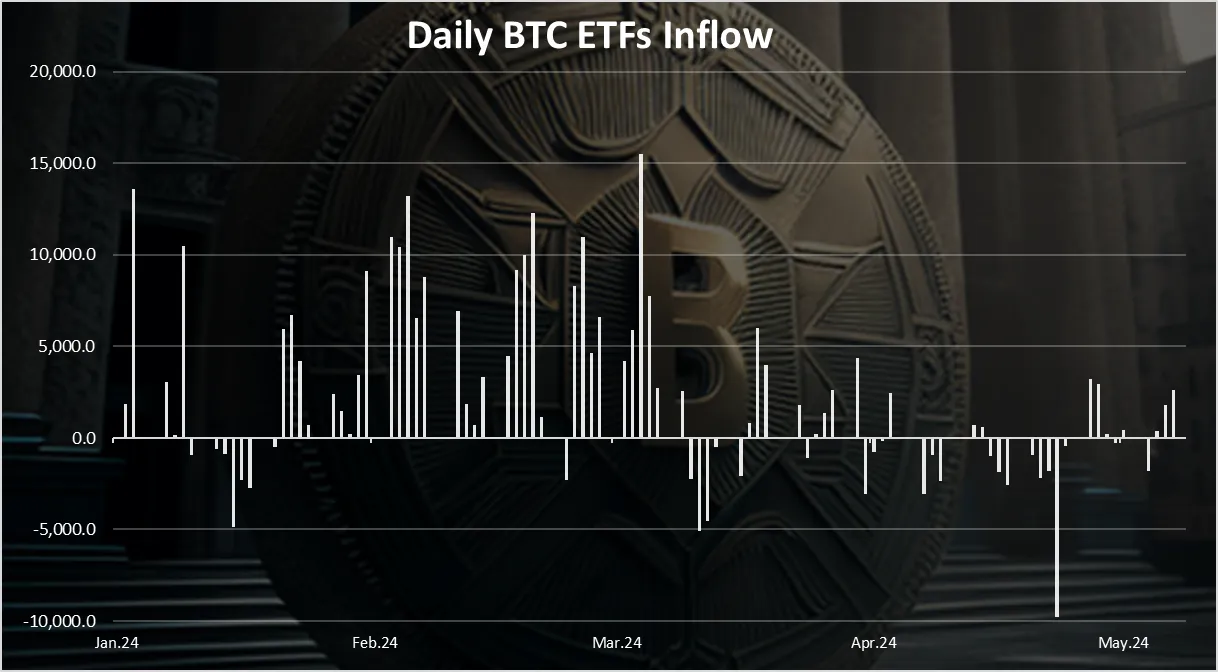
As we can see, most of the days the bars are in the positive. It seems that the peak happened somewhere at the end of February and the beginning of March 2024. Since then, the numbers have been smaller. At the peak there was a cumulative 15k daily BTC bought by the ETFs. In the last period these numbers are between -3k to +3k BTC. There was one big withdrawal at the end of April when almost 10k was withdrawn in one day.
Daily BTC ETFs Inflow by Fund
When we breakdown the daily inflows by fund we have this.

From here we can see the clear picture of who has been offloading BTC and who has been buying it. Grayscale has been almost daily reducing its holdings, while BlackRock has been on the opposite end and increasing its position. In the start, back in January 2024 these numbers were especially high, but they have lowered significantly in the last period.
Back in January at times there was days when Grayscale was selling 15k BTC daily. At the same time all the other funds were buying more than that.
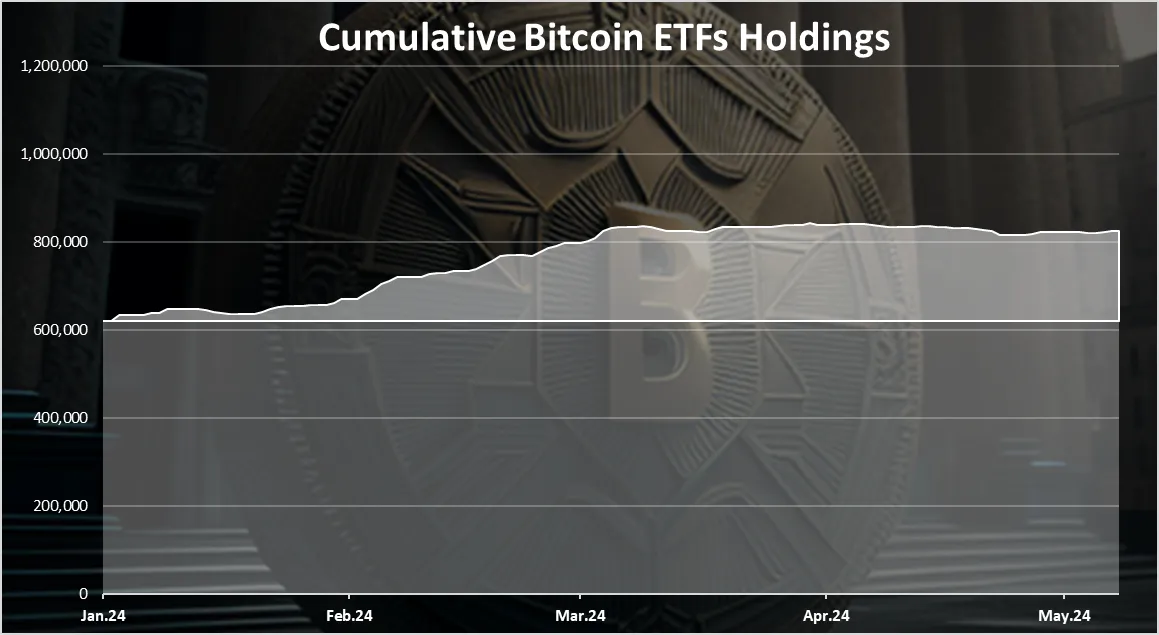
Cumulative Bitcoin ETFs Holdings
When we plot the daily inflows we have this:

We can notice that the chart didn’t started at zero but at 620k BTC. This is because of the Grayscale holding in the trust that were converted to ETFs when they were approved.
After the initial start we can notice a slow start and even some reduction in the holdings in January. More aggressive accumulation began in February and continued into March. Then in April 2024 there was a drop in the cumulative amount of Bitcoin in the ETFs. May has been somewhat neutral with almost stable amounts of Bitcoin in the ETFs.
At the moment there is 825k Bitcoins in the ETFs.
On a monthly basis the data looks like this.
| Month | BTC ETFs Inflows |
|---|---|
| Jan-24 | 28,985 |
| Feb-24 | 120,367 |
| Mar-24 | 64,328 |
| Apr-24 | -5,782 |
| May-24 | -2,508 |
February has been by far the month with the most aggressive accumulation of Bitcoin for the ETFs. The last two months have been negative, although May is not over yet and it is almost neutral.
When we breakdown the old and the new coins in the BTC ETFs we get this chart:
From here we can notice that the amount of new Bitcoins in the ETFs has been growing but its still lower than the starting point. At the start there was 620k BTC and now we are at 825k BTC. This is a growth of 200k more Bitcoins accumulated in the ETFs, but it still hasn’t surpassed the 620k that was initially held. It should be noted that its just been five months for the BTC ETFs, while Grayscale was accumulating the 620k for 10 years. We are very early in the BTC ETF era, and I expect these numbers to increase as years pass, but it will take time.
BTC ETF by Fund
When we breakdown the cumulative amount of Bitcoin in the ETFs by fund we get this:

From here we can clearly see the dominant position of Grayscale at the start and how they have reduced their size in time. Blackrock has been accumulating a lot in the meanwhile and is now almost at pair with Grayscale. In the last period both the selling of from Grayscale and the accumulation from Blackrock has slowed down.
Fidelity is in the third spot when it comes to BTC ETFs and the top three hold almost 90% of the ETFs.
The chart for Blackrock only looks like this:

An aggressive start from Blackrock from the very beginning and somewhat flattening in the last months. In May they have been almost constant in their holdings.
BlackRock VS Grayscale
When we plot the holdings of these two we have this.

Almost inverse pattern, where the amount of BTC ETFs in Grayscale has been going down, and in BlackRock up. They are now very close to each other around the 280k mark. Most likely BlackRock will soon flip Grayscale in the amount of BTC in ETFs.
Top BTC ETFs Holders
The chart for the top BTC ETFs holders as of May 18th looks like this:

Grayscale and BlackRock are now very close to each other with BlackRock having 287k BTC against the 274k BTC from Grayscale. Fidelity is on the third spot with also a significant amount of 150k BTC.
When we plot the chart as a pie we get this:

From here we can see the share of each individual ETF, and we can notice that the top three are dominant, holding 85% of the BTC ETfs.
Overall, we can conclude that there was a sharp growth in the BTC in ETFs in February and somewhat March, and then a slowdown in April and May. This has more or less reflected in the price as well, although the correction so to speak has been very mild and Bitcoin is now trading at 67k, just slightly below its ATH of 72k. Grayscale has been bleeding out in all of the period, while BlackRock accumulating. Fidelity is also holding a significant share. In the last months the numbers have somewhat stabilized with small changes in both directions. We are free to conclude that if the demand from February repeats somewhere in the near future we can for sure see an impact in the price. Also this is just a few months for these investment instruments being live and things will look much different in a few years from now.
All the best
@dalz