Is Bitcoin about to break all-time highs?
According to technical analysis, that may very well be the case, and Bitcoin might break $3000 this month.

In this post, we will take a closer look at the Bitcoin price over the past few months, and use this information to speculate on what the price may be in the near future.
Get comfortable, go make some coffee, because this is going to be a long one.
Let's take a look at the charts!
The daily chart

The image above shows daily candlesticks of Bitcoin's price, from the middle of May, until now.
You will notice very volatile price action, with lots of steep run-ups and sharp drops offs. However, this action seems to get less and less intense with every wave. Also, notice how the lows get higher each time, as the price follows the upward trend.
This is known as "consolidation", and is the price's way of settling, before it gets ready to make its way up again.
The 4-hour chart
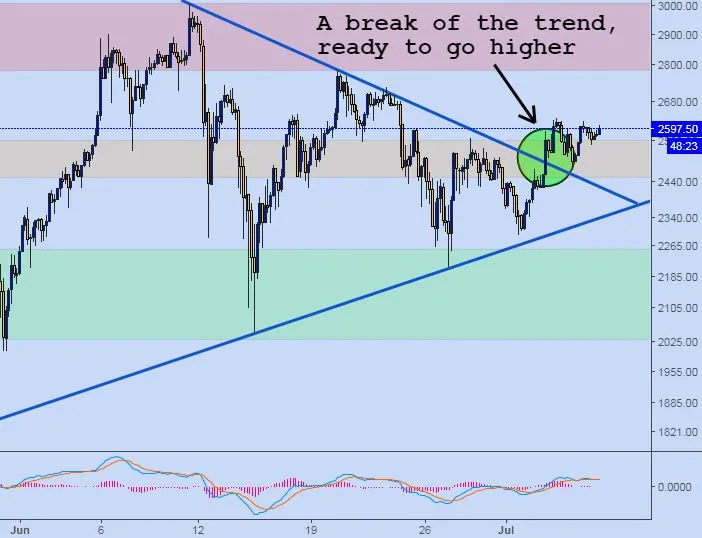
The image above shows 4 hour candlesticks of Bitcoin's price, from the beginning of June, until now.
By looking at the 4 hour chart, we can get a closer look at what's going on. Notice how Bitcoin has now broken out of the trend. I have highlighted this in green. This could signify that Bitcoin is ready to begin the next leg up.
But where's the proof?
I'm a firm believer in the idea that history repeats itself. And so, with this in mind, I feel that the best way to predict the future, is to see what happened in the past. This is one of my methods of trading.
Back to March
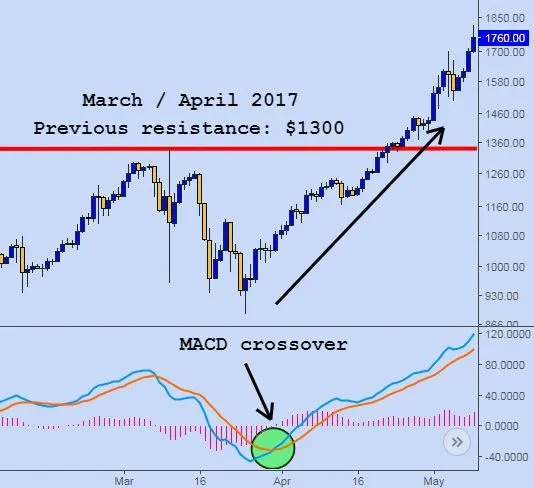
The above screenshot shows the price of Bitcoin back in March / April of this year.
My favorite trading indicator is the MACD. It's those little orange and blue lines at the bottom of my charts, and it helps to predict price movement. You can read more on this here:
http://www.investopedia.com/terms/m/macd.asp
For the purpose of this post, all you need to know, is that a "MACD crossover" (which is when the blue line crosses above the orange line) is a very good sign, and means that the momentum is in favor of upwards price movement.
Notice how at a similar time that the blue line (the MACD line) crosses above the orange line (the signal line), the price also starts to move upwards, and breaks through previous areas of resistance and on to new all-time highs.
A MACD crossover means upward movement
So now that we've covered the MACD, and how it affected the price in the past, let's take a look at the price today.
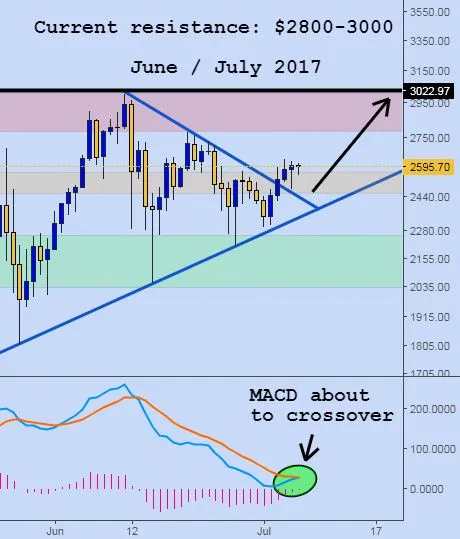
Above: daily candles of Bitcoin's price in June / July.
Compare the screenshot above to the one taken in March. Both were taken after Bitcoin reached new all-time highs, and then dropped off.
Also notice how the MACD's in both pictures are similar. Right now, the MACD for July (which is now) is about to crossover. When this last happened in April, Bitcoin went up in price and broke through previous levels of resistance, and went on to set new highs.
So is history repeating itself?
Perhaps. The charts look very similar. In March, we reached a new all-time high, followed by a steep drop off, and then we recovered and went up again, as soon as the MACD crossed over the signal line.
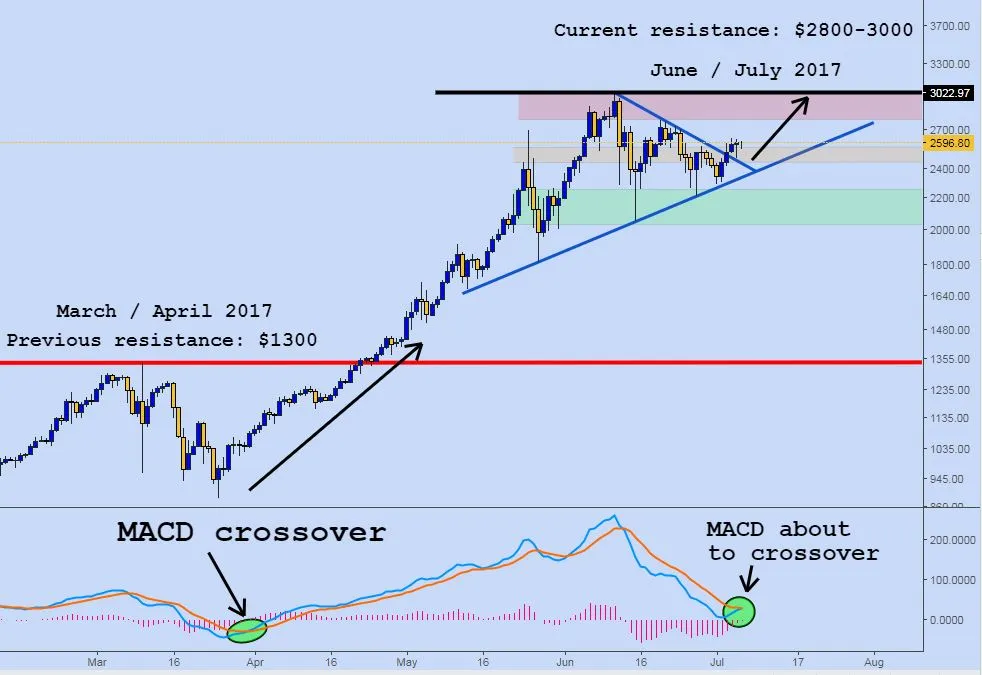
Right now, we are at a similar point. The Bitcoin price recently hit an all-time high of $3000, and then had steep drop offs. The MACD looks exactly the same as it did before the price took off last time.
Everything is in place for Bitcoin to break new highs.

If you enjoyed this post or found it helpful, please don't forget to upvote and follow me for more content. Also, leave your comments or thoughts down below, I'd love to hear what you guys think.