Bitcoin


Daily Chart
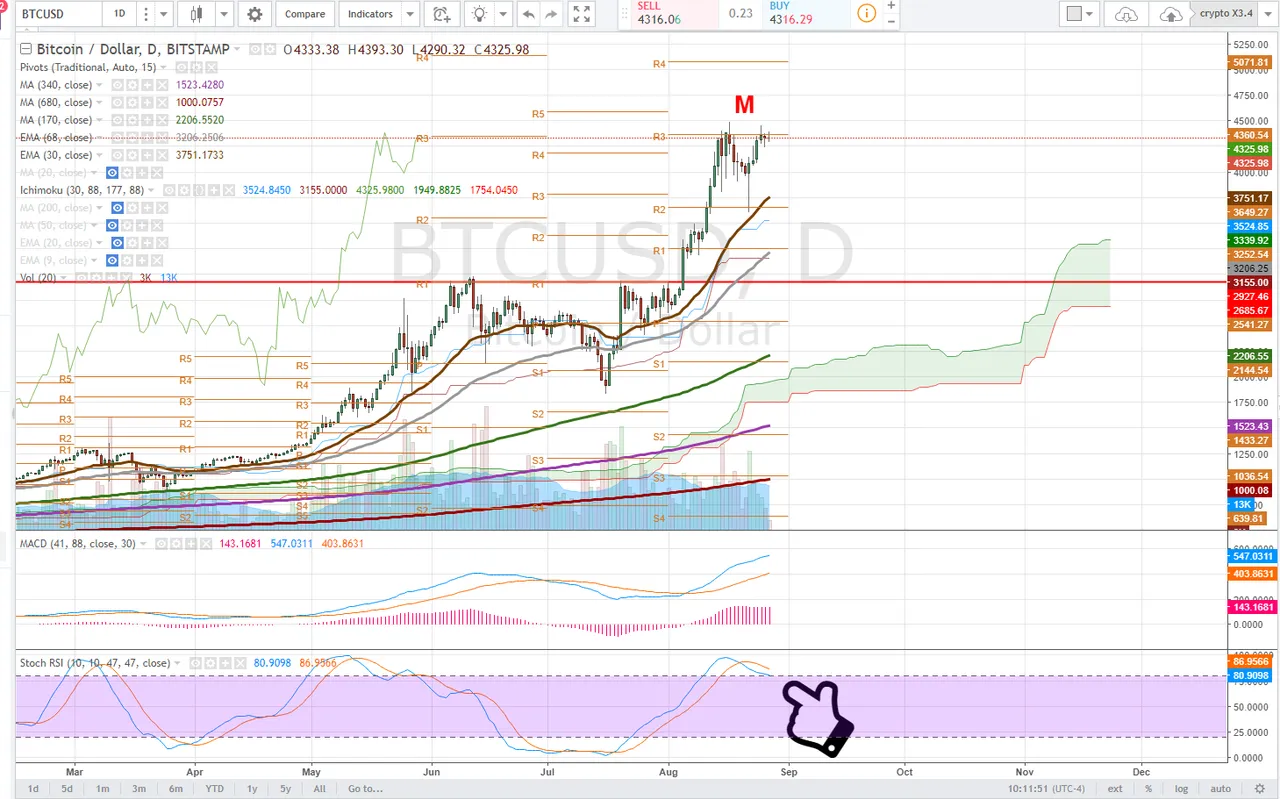
Bitcoin USD on the daily time frame has made some pretty massive and profitable moves for some, but has still failed to print a higher high. BTCUSD is possibly setting an M Top, or double top which could lead to some heavy downside action.
In order to remain immediate term bullish BTC USD needs a surge of buying volume to eat the supply up here in the 4300-4400 range.
Notice the extended daily stochastic RSI. Traders and investors should view BTCUSD as trend-less until it chooses a direction. If BTCUSD fails to get some bullish momentum a trip to the 30 day exponential moving average is expected where we would look for buyers to step in or not. On the other hand if demand comes in here we would look for a higher high to be printed.
4 Hour Chart
Counter to the M top this could also be viewed as a bull flag on the 4 hour time frame, however we again look at our momentum indicators, the stochastic RSI and volume. The Stochastic RSI on the 4 hour time frame is starting to curl down while volume wanes.
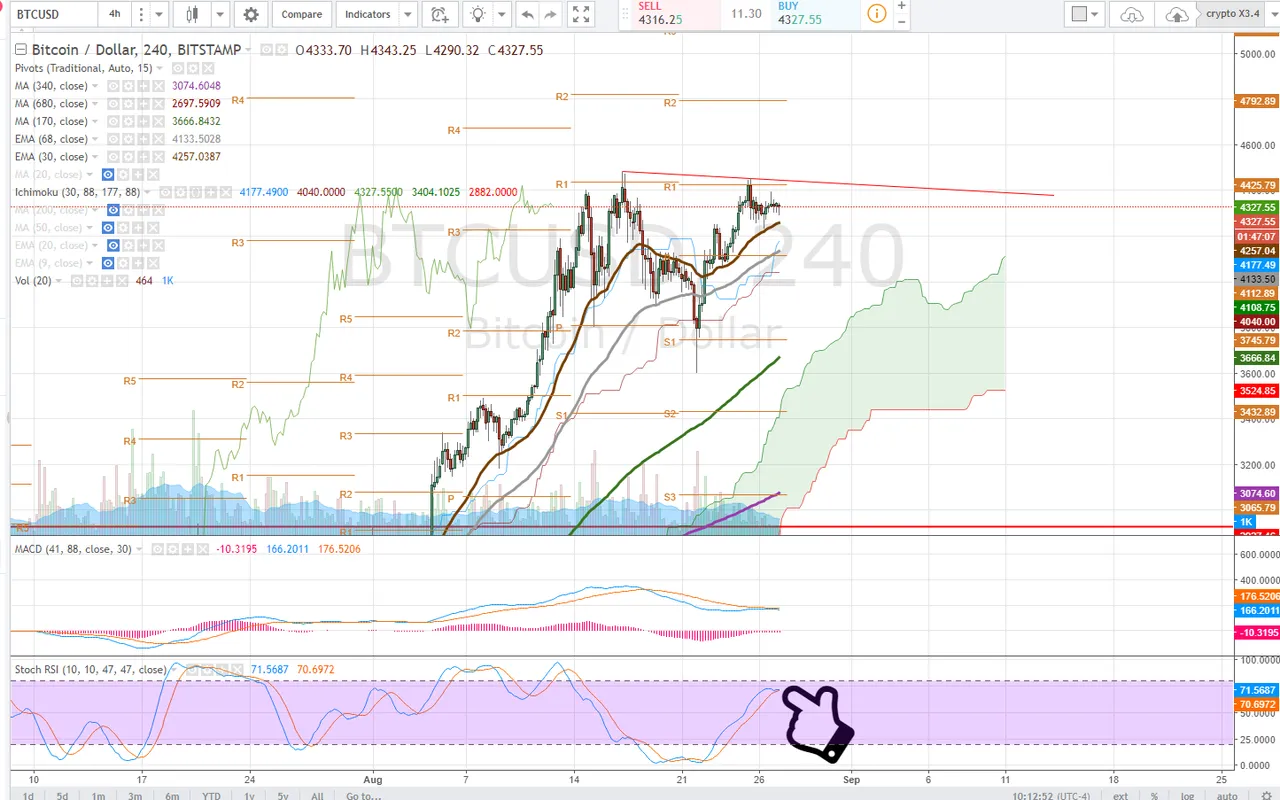
BTCUSD is a mid ground trade at the moment and the risk averse should be waiting for direction to take a position or setting a stop loss to lock in gains or prevent losses.
Ethereum
Daily Chart
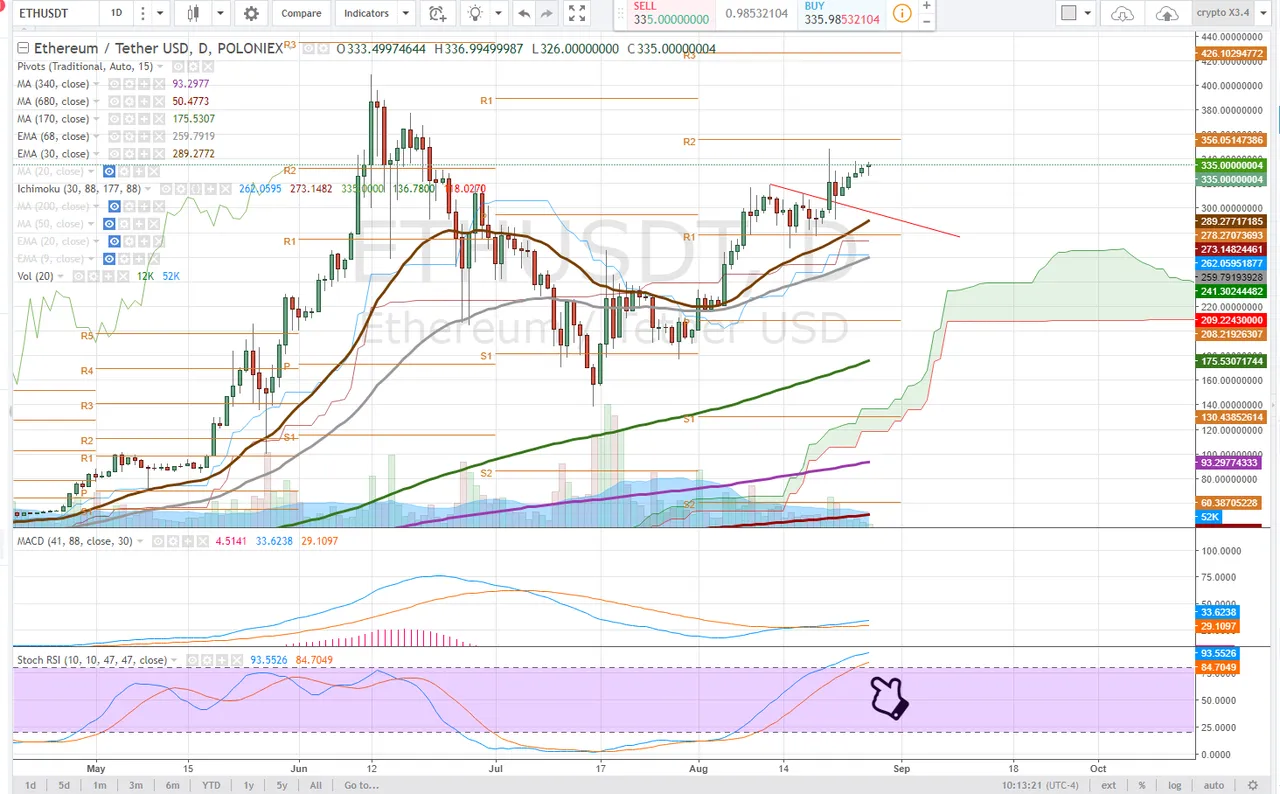
Ethereum recently broke out of a bull flag on the daily time frame on volume testing the $347 level before backtesting the breakout. Notice the Stochastic RSI has reached oversold (uptrend signaling). Again, ETH needs buyers to continue to come in and push higher or we will see another re-test of the bullflag breakout - approximatley the $308 level.
4 Hour Chart
The 4-hour time frame is showing us a stochastic RSI that is in the midground, not oversold, demand for ETHUSD would continue to drive the uptrend here and we look for more volume.
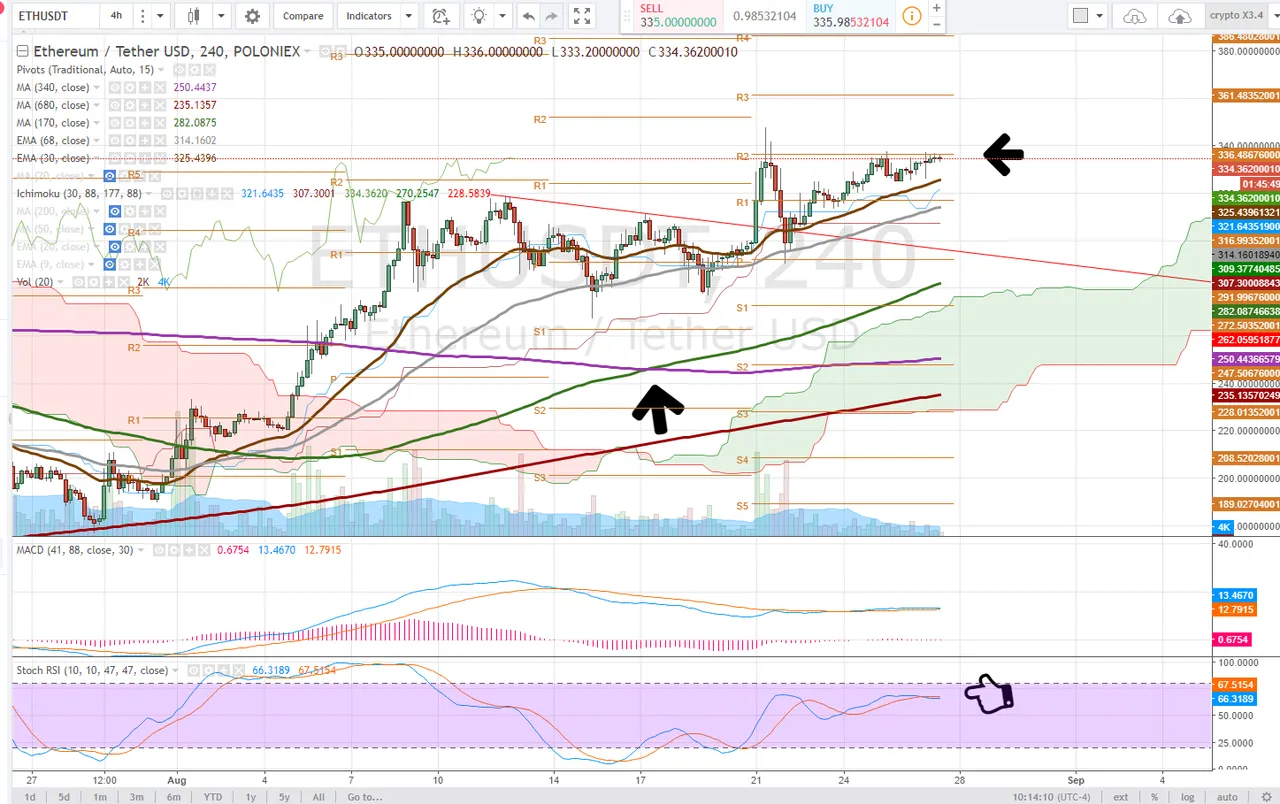
Entering a trade here is a little risky, traders and investors should wait for a surge in volume or scale into position, buying some now and adding on upside confirmation (volume) or on a pull back, ready to take a loss if the price looses the $300's level
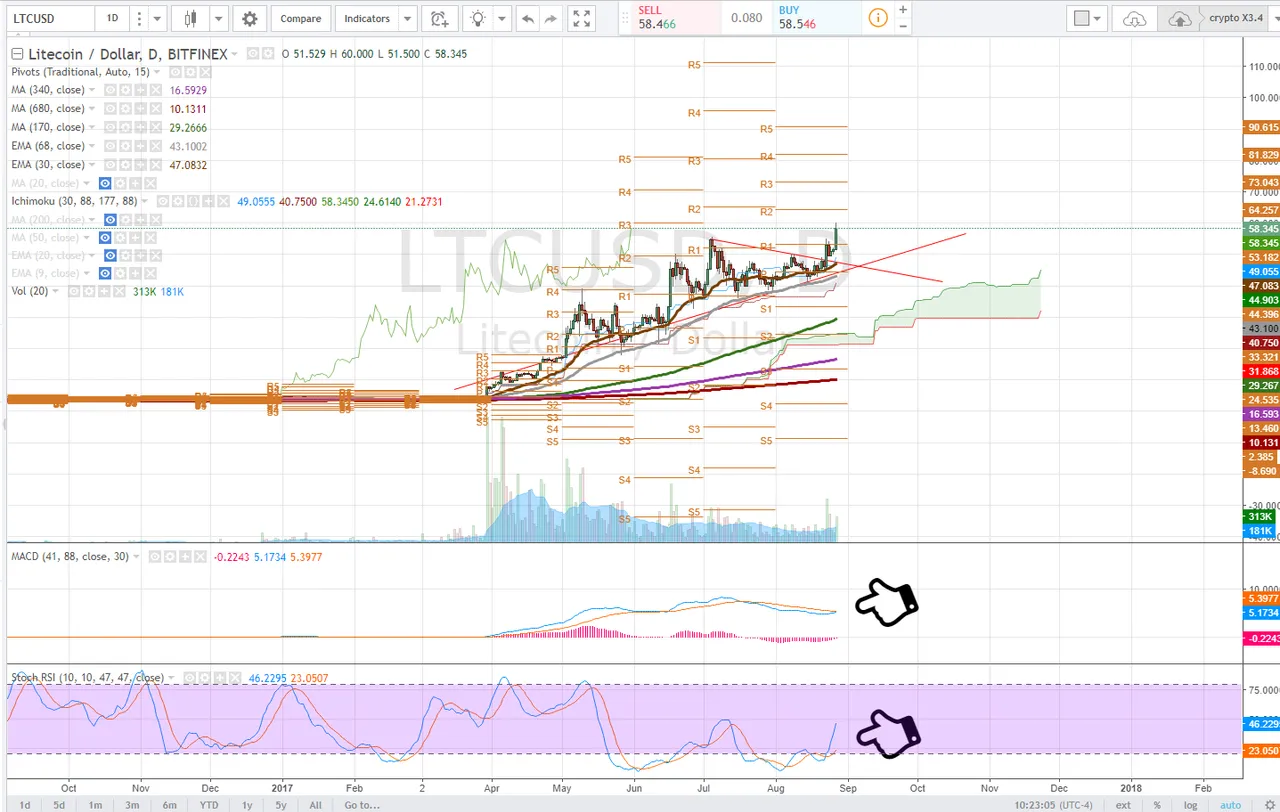
LiteCoin
Daily Chart
LiteCoin made a massive overnight move as it broke out of the wedge that had formed on the daily time frame reaching over $60 and setting a new all time high. This is very bullish price action and we look to the stochastic RSI and MACD for an idea of further strength.
The Stochastic RSI has just turned up from downtrend and this has set the MACD up for a bullish cross. After a pullback and price consolidation, I expect the bullish momentum to continue, however, traders and investors should always be cautious buying high.
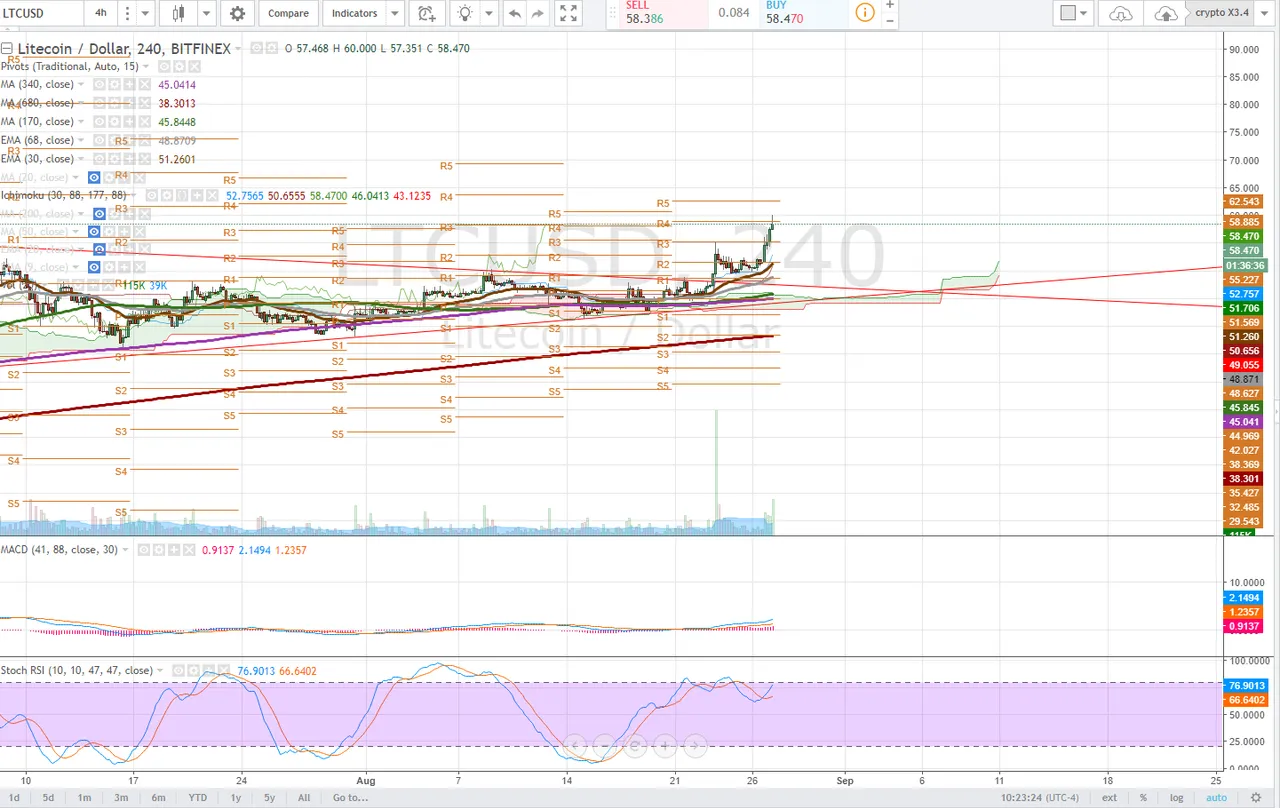
4 Hour Chart
The 4 hour timeframe displays some very obvious spikes in volume that drove both the Stochastic RSI and MACD bullish. A backtest and hold of the $55 range would be a buying opportunity.
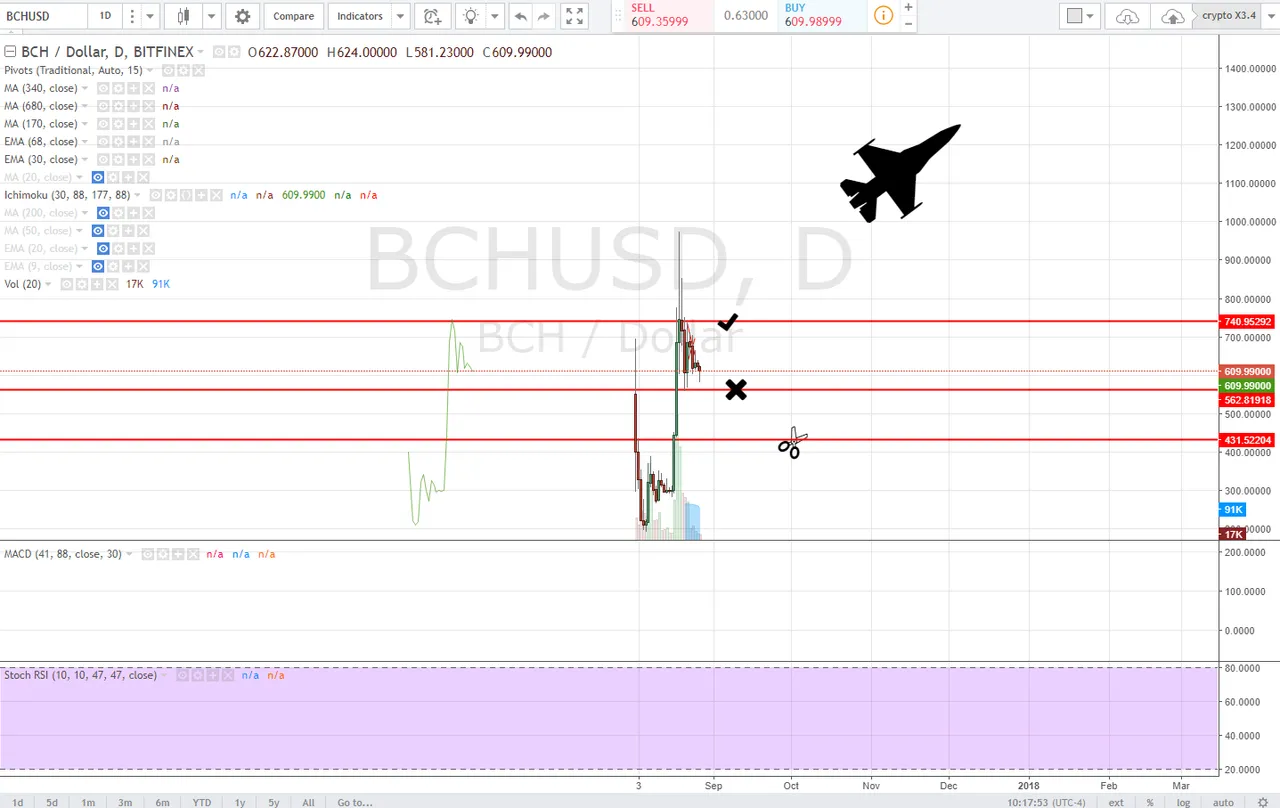
BitCoin Cash
Daily Chart
With little chart data, bitcoin Cash is a little more difficult to do technical analysis on. With the daily time frame we have identified some key areas of support and resistance, Support being $562 and resistance at approximately $740. On balance the candle stick formations appear to be a bullflag, however I would warrant caution as this can become extremely volatile depending on the direction of BTCUSD.
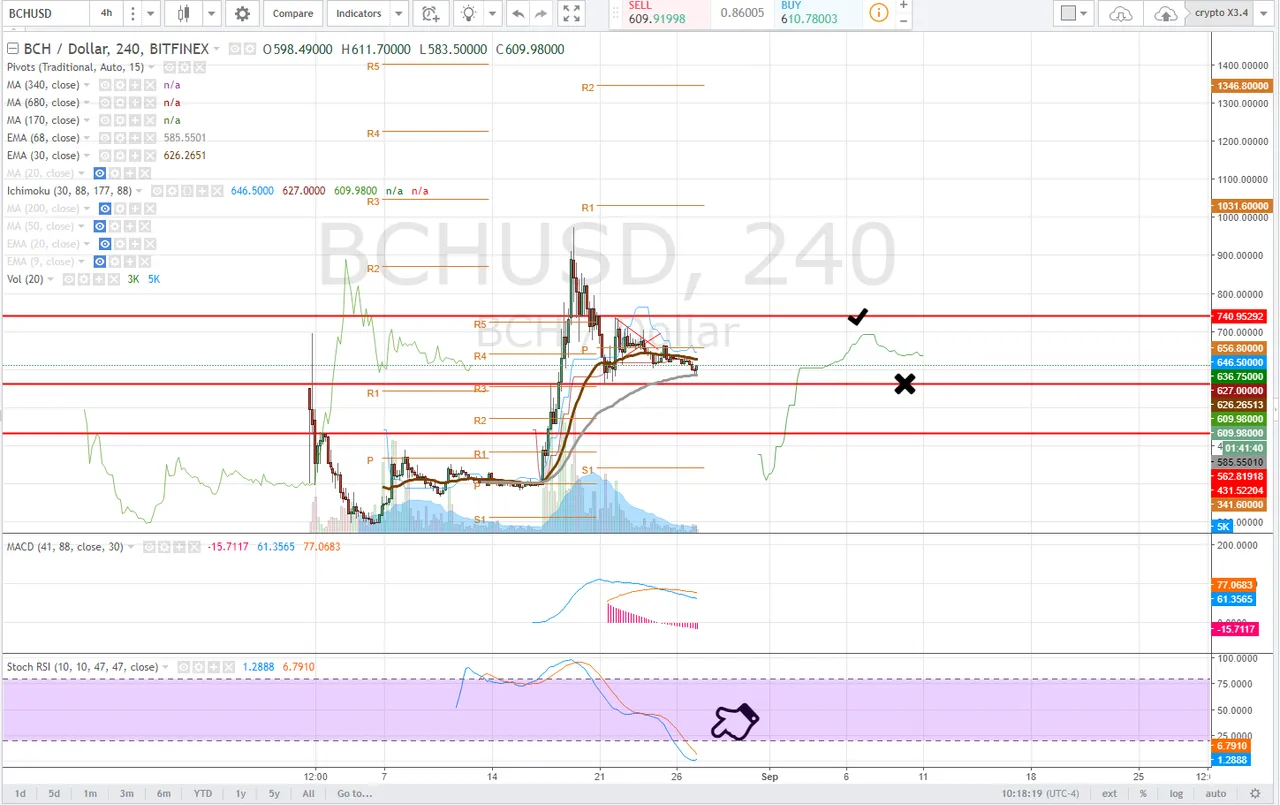
4 Hour Chart
Clear support has been found at the 68 day exponential moving average with some buyers stepping in. If one took a position here, a stop loss below this level would be excellent risk management.
XMR
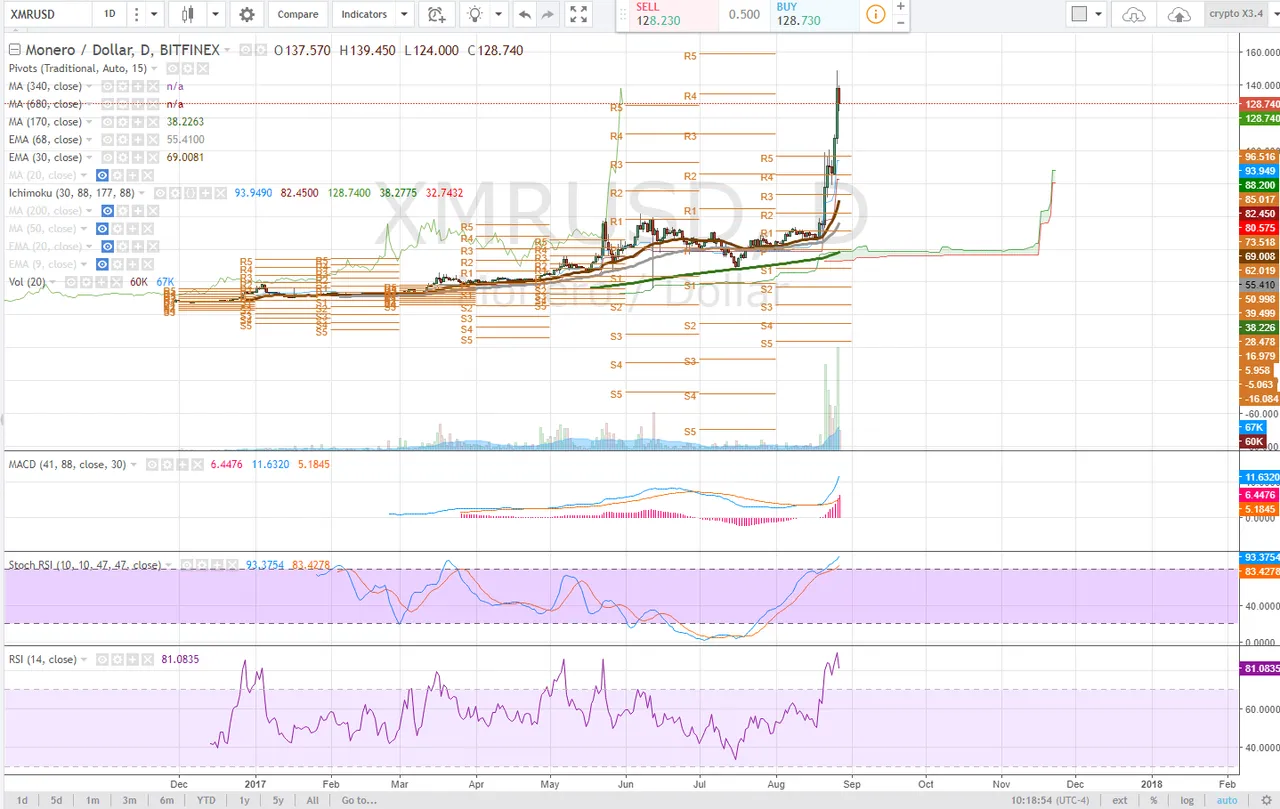
Daily Chart
XMR broke out with some insane gains, however the price action is becoming less sustainable and we are seeing some consolidation to the downside up here. Buying here is not recommended. The RSI is deep in overbought territory and a pullback is imminent. Wait for the Stochastic RSI on the daily time frame to full cycle before taking a position.
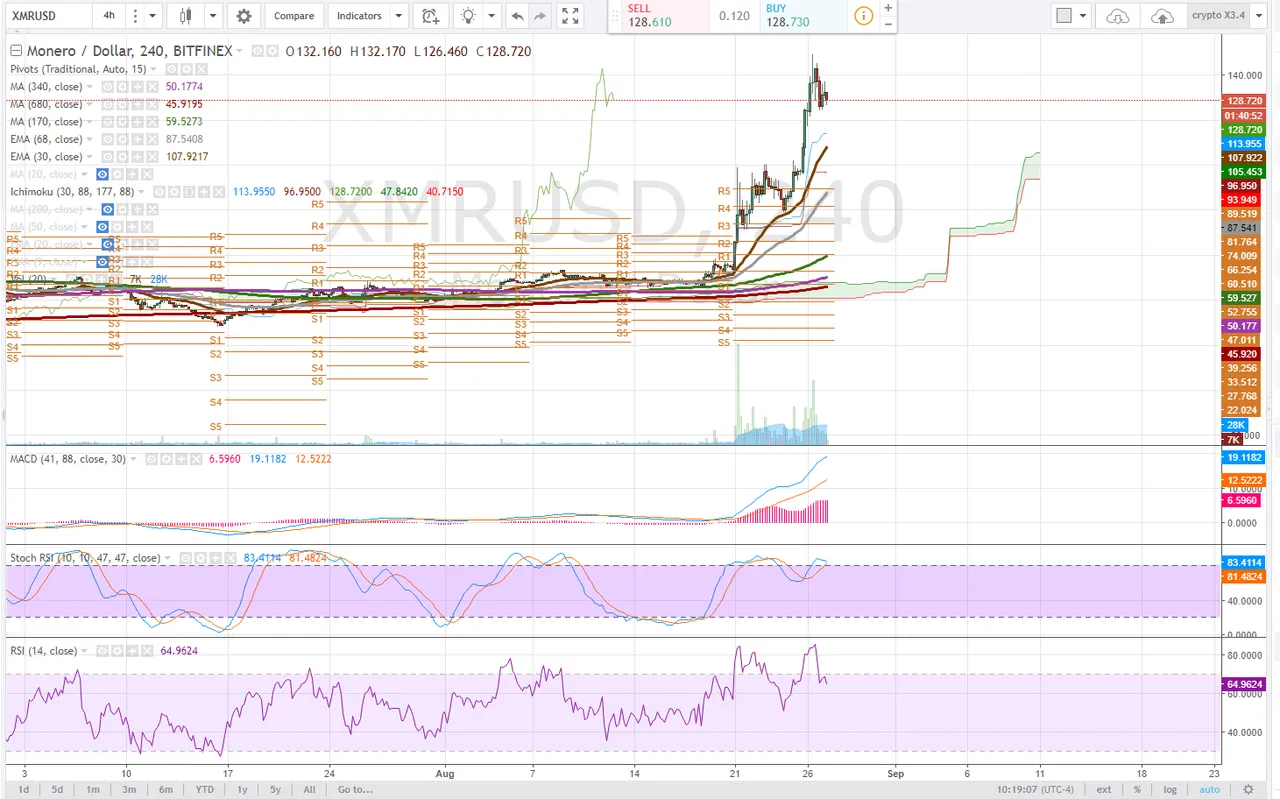
4 Hour Chart
On the 4 hour time frame, notice the Stochastic RSI curling to the downside, if it achieves a bull cross it will drag the MACD down with it. I would look for support around the 30 day exponential moving average, currently $108 and if that fails to hold a back test of the previous high $101. Failing to hold $100 would be very bearish as this a psychological level. In otherwords you would be crazy to buy here, patience will pay off if you are looking for an entry.
Follow at your own risk, Not a financial adviser, understand the risks associated with trading and investing. The views expressed in this article are that of the authors and are intended mostly for educational purposes. There may be a delay between the time this article was written and the time it is posted.