
SUMMARY
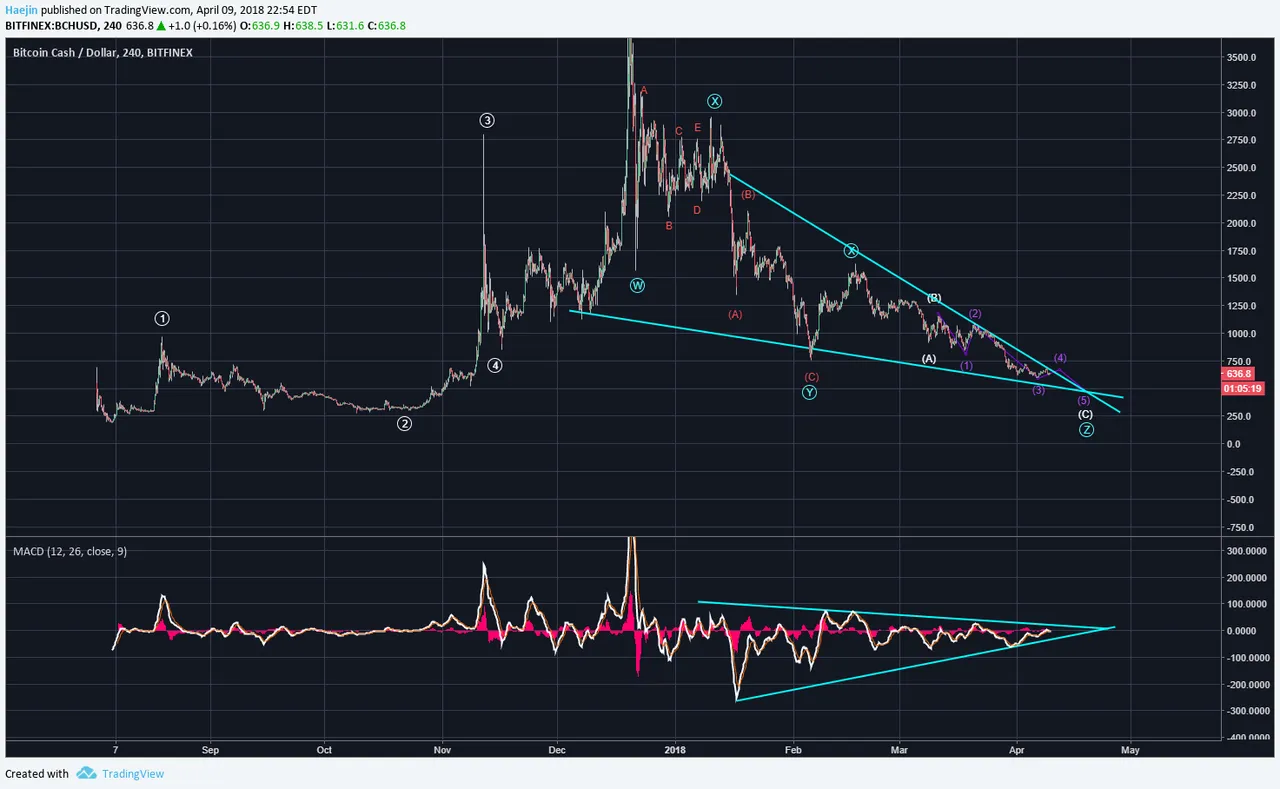
On April 9th, the below chart of Bitcoin Cash (BCH) was posted with a high likelihood of price breakout given how close it and MACD were to the apex point. Price was $636 and price surged as high as $1,581 translating into a 146% profit!!
On April 22nd, the breakout was evidenced and the five wave impulse onset was initiated. Price and MACD both started their breakouts near simultaneously.
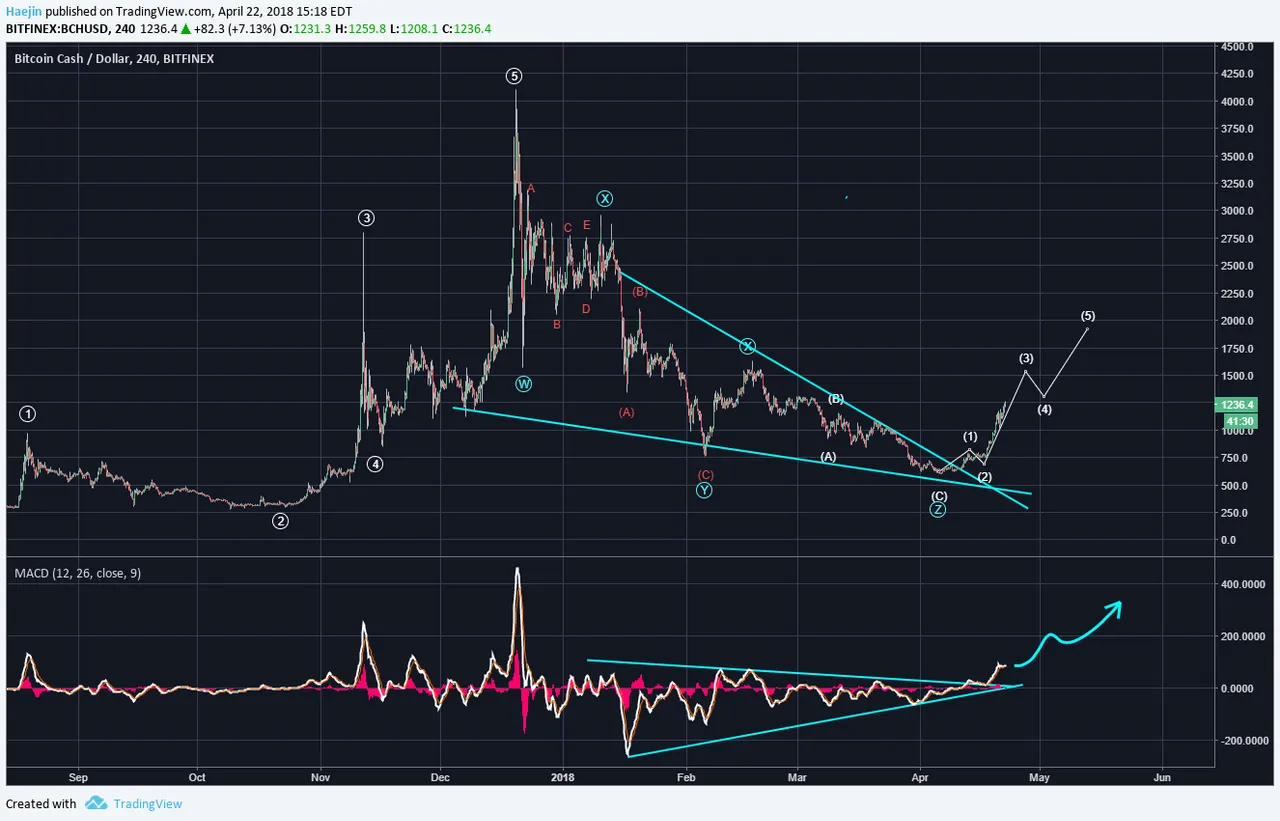
The current chart shows that of the five wave impulse, waves 1,2,3 are complete. Thus, the current minor decline is an incremental correction for wave 4. The red ABC shows the probable price pathway of a flat (3,3,5) correction. The MACD is expected to swing back upwards once the wave 4 is placed so that wave 5 can complete. Target for wave 5 is $2,130 or so.

Legal Disclaimer: I am not a financial advisor nor is any content in this article presented as financial advice. The information provided in this blog post and any other posts that I make and any accompanying material is for informational purposes only. It should not be considered financial or investment advice of any kind. One should consult with a financial or investment professional to determine what may be best for your individual needs. Plain English: This is only my opinion, make of it what you wish. What does this mean? It means it's not advice nor recommendation to either buy or sell anything! It's only meant for use as informative or entertainment purposes.
Please consider reviewing these Tutorials on:
Elliott Wave Counting Tutorial #1
Elliott Wave Counting Tutorial #2
Elliott Wave Counting Tutorial #3
Laddering and Buy/Sell Setups.
Laddering Example with EOS
Tutorial on the use of Fibonacci & Elliott Waves
@haejin's Trading Nuggets
Essay: Is Technical Analysis a Quantum Event?
Follow me on Twitter for Real Time Alerts!!
Follow me on StockTwits for UpDates!!
--
--

