
SUMMARY
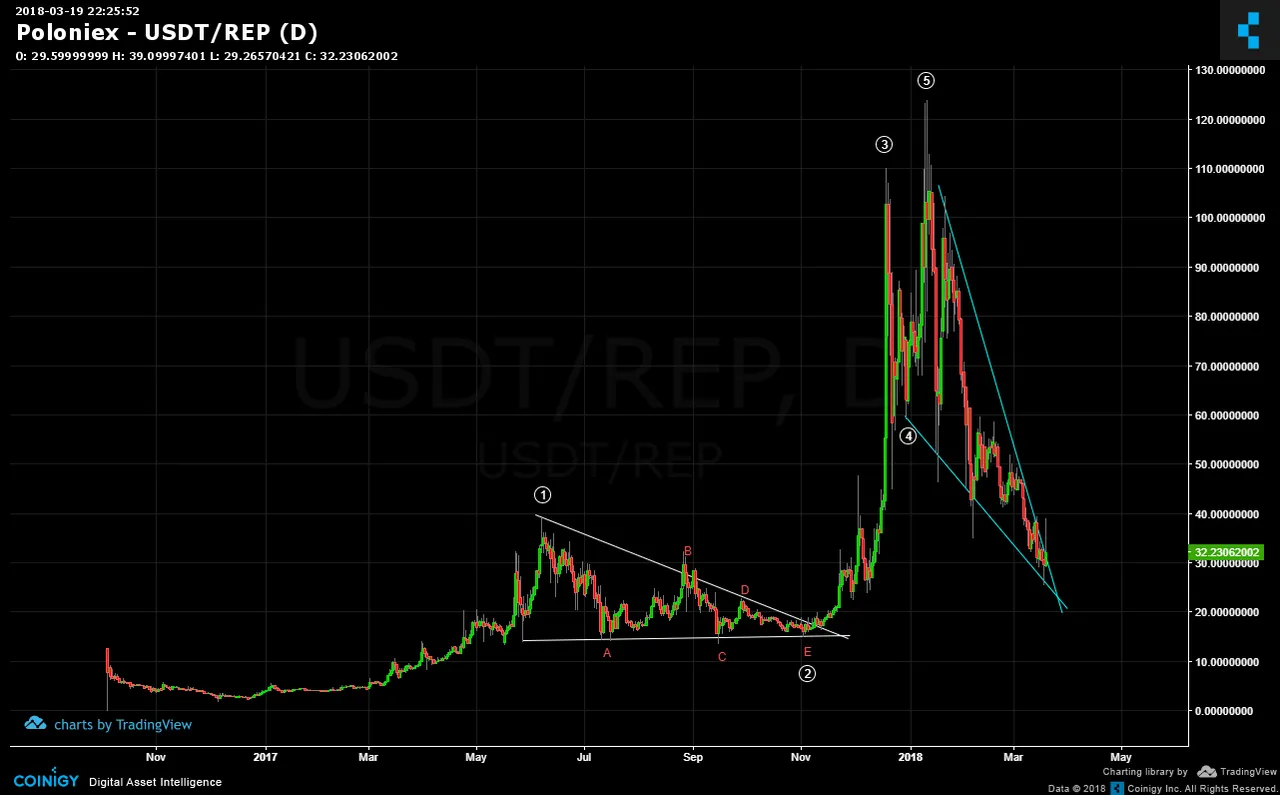
Augur (REP/USD) has generated a very classice five wave impulse up as shown in the below chart. Wave 2 was an abcde triangle while 3,4,5 completed in very precise Fibonacci ratio. The current correction was a steep angled decline as a wedge pattern and for Altcoins, this usually is an indication of a breakout which is quickly followed by further sideways action.
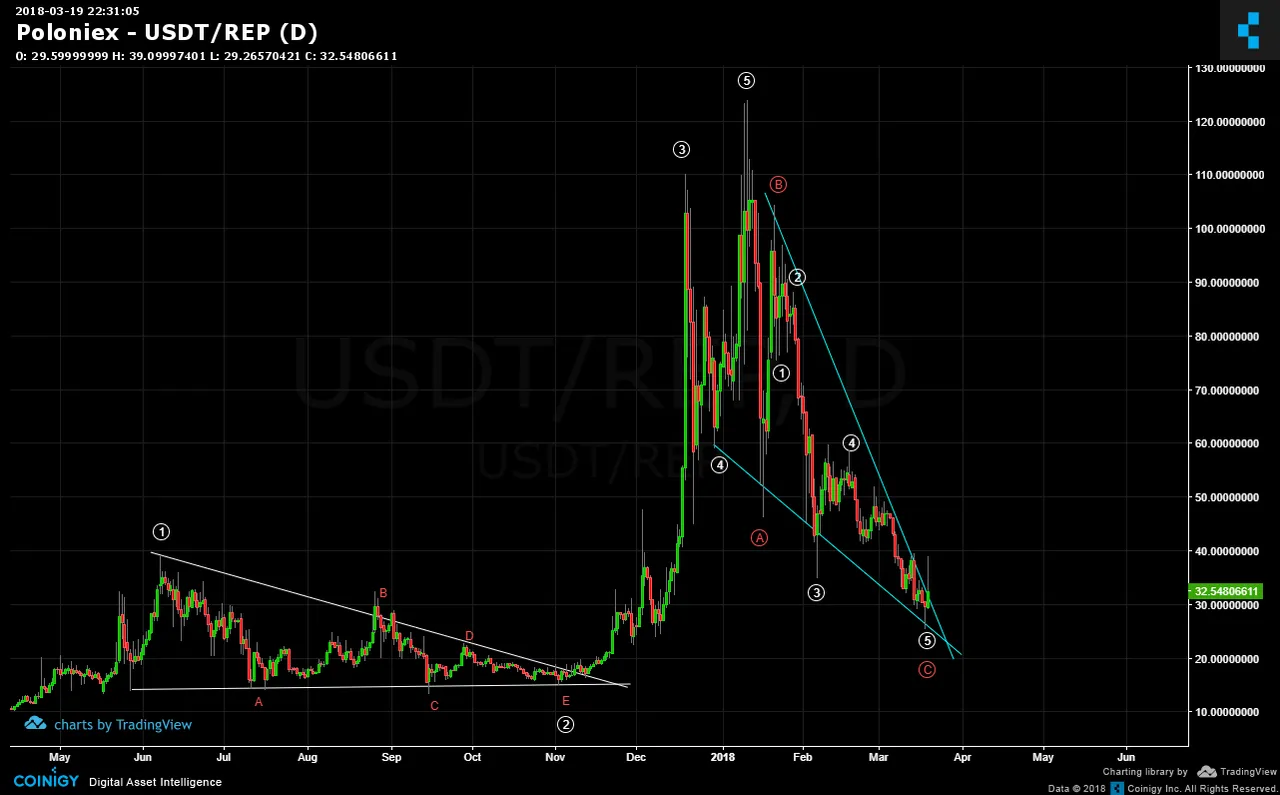
The correction is best counted as an ABC and price is very close to the Apex point. So, on the short term, a breakout is expected and that should carry prices higher. But, as said before, the steepness of the ABC also makes likely further sideways price action which should be kept into awareness.
Legal Disclaimer: I am not a financial advisor nor is any content in this article presented as financial advice. The information provided in this blog post and any other posts that I make and any accompanying material is for informational purposes only. It should not be considered financial or investment advice of any kind. One should consult with a financial or investment professional to determine what may be best for your individual needs. Plain English: This is only my opinion, make of it what you wish. What does this mean? It means it's not advice nor recommendation to either buy or sell anything! It's only meant for use as informative or entertainment purposes.
Please consider reviewing these Tutorials on:
Elliott Wave Counting Tutorial #1
Elliott Wave Counting Tutorial #2
Elliott Wave Counting Tutorial #3
Laddering and Buy/Sell Setups.
Laddering Example with EOS
Tutorial on the use of Fibonacci & Elliott Waves
@haejin's Trading Nuggets
Essay: Is Technical Analysis a Quantum Event?
Follow me on Twitter for Real Time Alerts!!
Follow me on StockTwits for UpDates!!
--
--

