Dear my steemian friends, I want to show you a 3D animation design that absorbs the concept of virtual reality in its design. Just look at the following and hopefully you all like it.
- Analysis of Application Testing Results Using Questionnaires
This application testing is targeted to various groups such as high school students, students, entrepreneurs and others. Testing this application is done by running the application to the user and guiding the user in using the application. After the user has finished browsing the application then given a questionnaire containing questions related to the application. The questionnaire will be used to obtain data that will be processed and analyzed. The questionnaire distributed contains 10 questions that must be filled with answer choices in the form of opinions Strongly Agree (SS), Agree (S), Less Agree (KS), Disagree (TS), Strongly Disagree (STS). Data is processed and presented in table form. To find the percentage value of each answer to the questionnaire, the Likert scale formula is used as follows.

Description :
- P (S) : Percentage of sub variables
- S : Number of scores for each sub variables
- N : Total maximum score
Here is the percentage of each answer ten questions which are then computed value by using the formula (4.1).
1. The test results for question number 1 are shown in Table 7

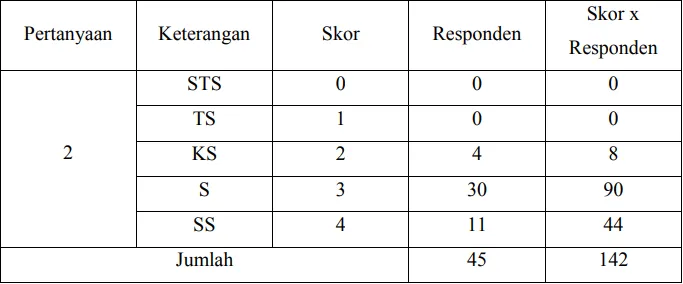
2. The test results of question number 2 are shown in Table 8
3. Test results for question number 3 are shown in Table 9

4. The test results for question number 4 are shown in Table 10

5. The test results of question number 5 are shown in Table 11

6. The results of testing question number 6 are shown in Table 12

7. The results of testing question number 7 are shown in Table 13

8. The test results of question number 8 are shown in Table 14

9. The results of testing question number 9 are shown in Table 15

10. The results of testing question number 10 are shown in Table 16

Assessment interval :

Conclusion
The conclusions that can be drawn from this study are as follows:
- Virtual Reality can be an alternative means of learning history.
- Sources of information about the Battle of Sipirok area are very limited, so the creation of the 3D modeling environment is made only based on the existing image.
- When run, this application has a frame rate (fps) of around 10-15, because it requires a higher graphics card.
- VR creation requires a long and long process, so that it is done in the form of a team to reduce the time needed and get better results.
DONE...!!!

Wondering How Steemit Works, Read Steemit FAQ?