
SUMMARY
From a pattern, Elliott Waves and Indicator perspective, Adex (ADX/USD) has been traversing as projected. In fact, from the last post on ADX which was at $0.71; it has risen 50%...not too shabby!
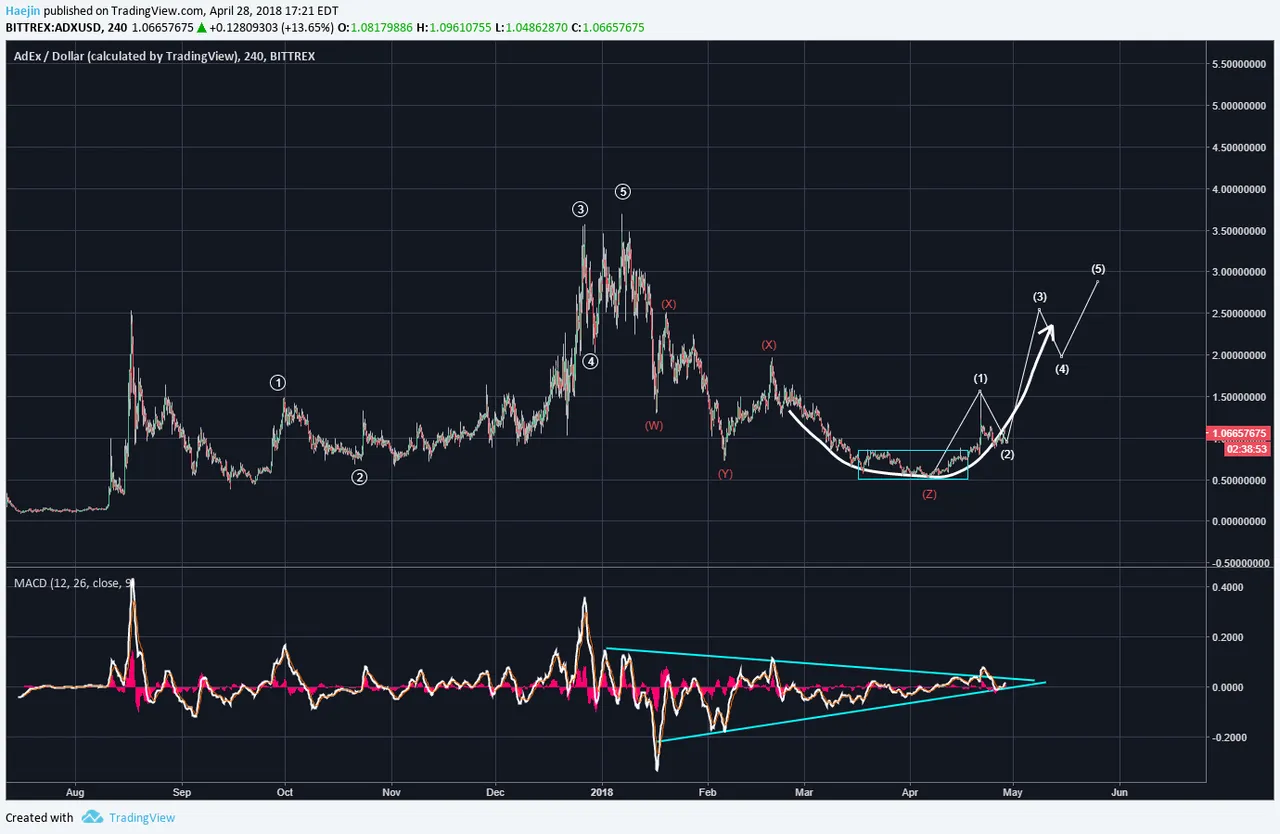
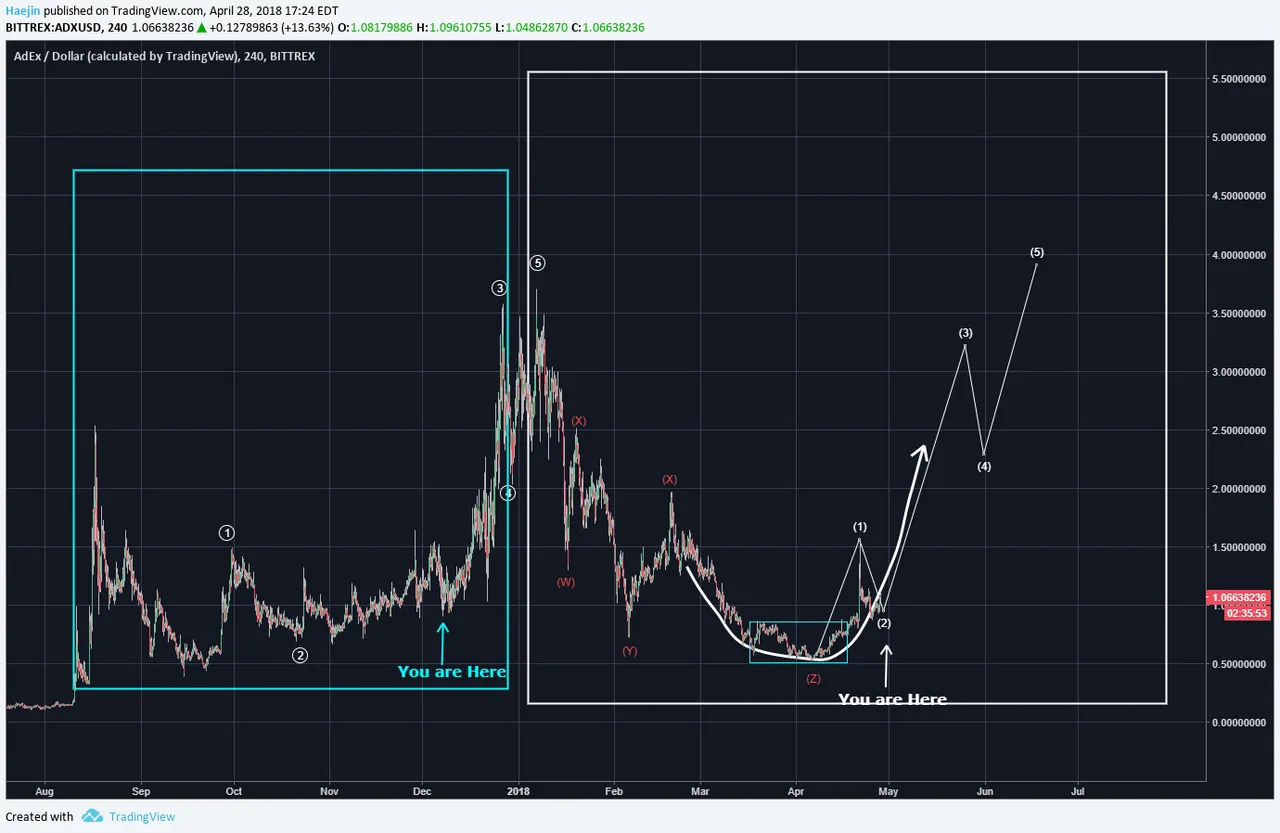
The fractal is shown in the below chart. The blue box and the white box have very similar price movements and sequence. Per the "You are here" marker; it seems like ADX is very close to a sizable price rise. I've updated the Elliott Waves to indicate the coming rise to be equal to the prior top but likely higher.
Legal Disclaimer: I am not a financial advisor nor is any content in this article presented as financial advice. The information provided in this blog post and any other posts that I make and any accompanying material is for informational purposes only. It should not be considered financial or investment advice of any kind. One should consult with a financial or investment professional to determine what may be best for your individual needs. Plain English: This is only my opinion, make of it what you wish. What does this mean? It means it's not advice nor recommendation to either buy or sell anything! It's only meant for use as informative or entertainment purposes.
Please consider reviewing these Tutorials on:
Elliott Wave Counting Tutorial #1
Elliott Wave Counting Tutorial #2
Elliott Wave Counting Tutorial #3
Laddering and Buy/Sell Setups.
Laddering Example with EOS
Tutorial on the use of Fibonacci & Elliott Waves
@haejin's Trading Nuggets
Essay: Is Technical Analysis a Quantum Event?
Follow me on Twitter for Real Time Alerts!!
Follow me on StockTwits for UpDates!!
--
--

