
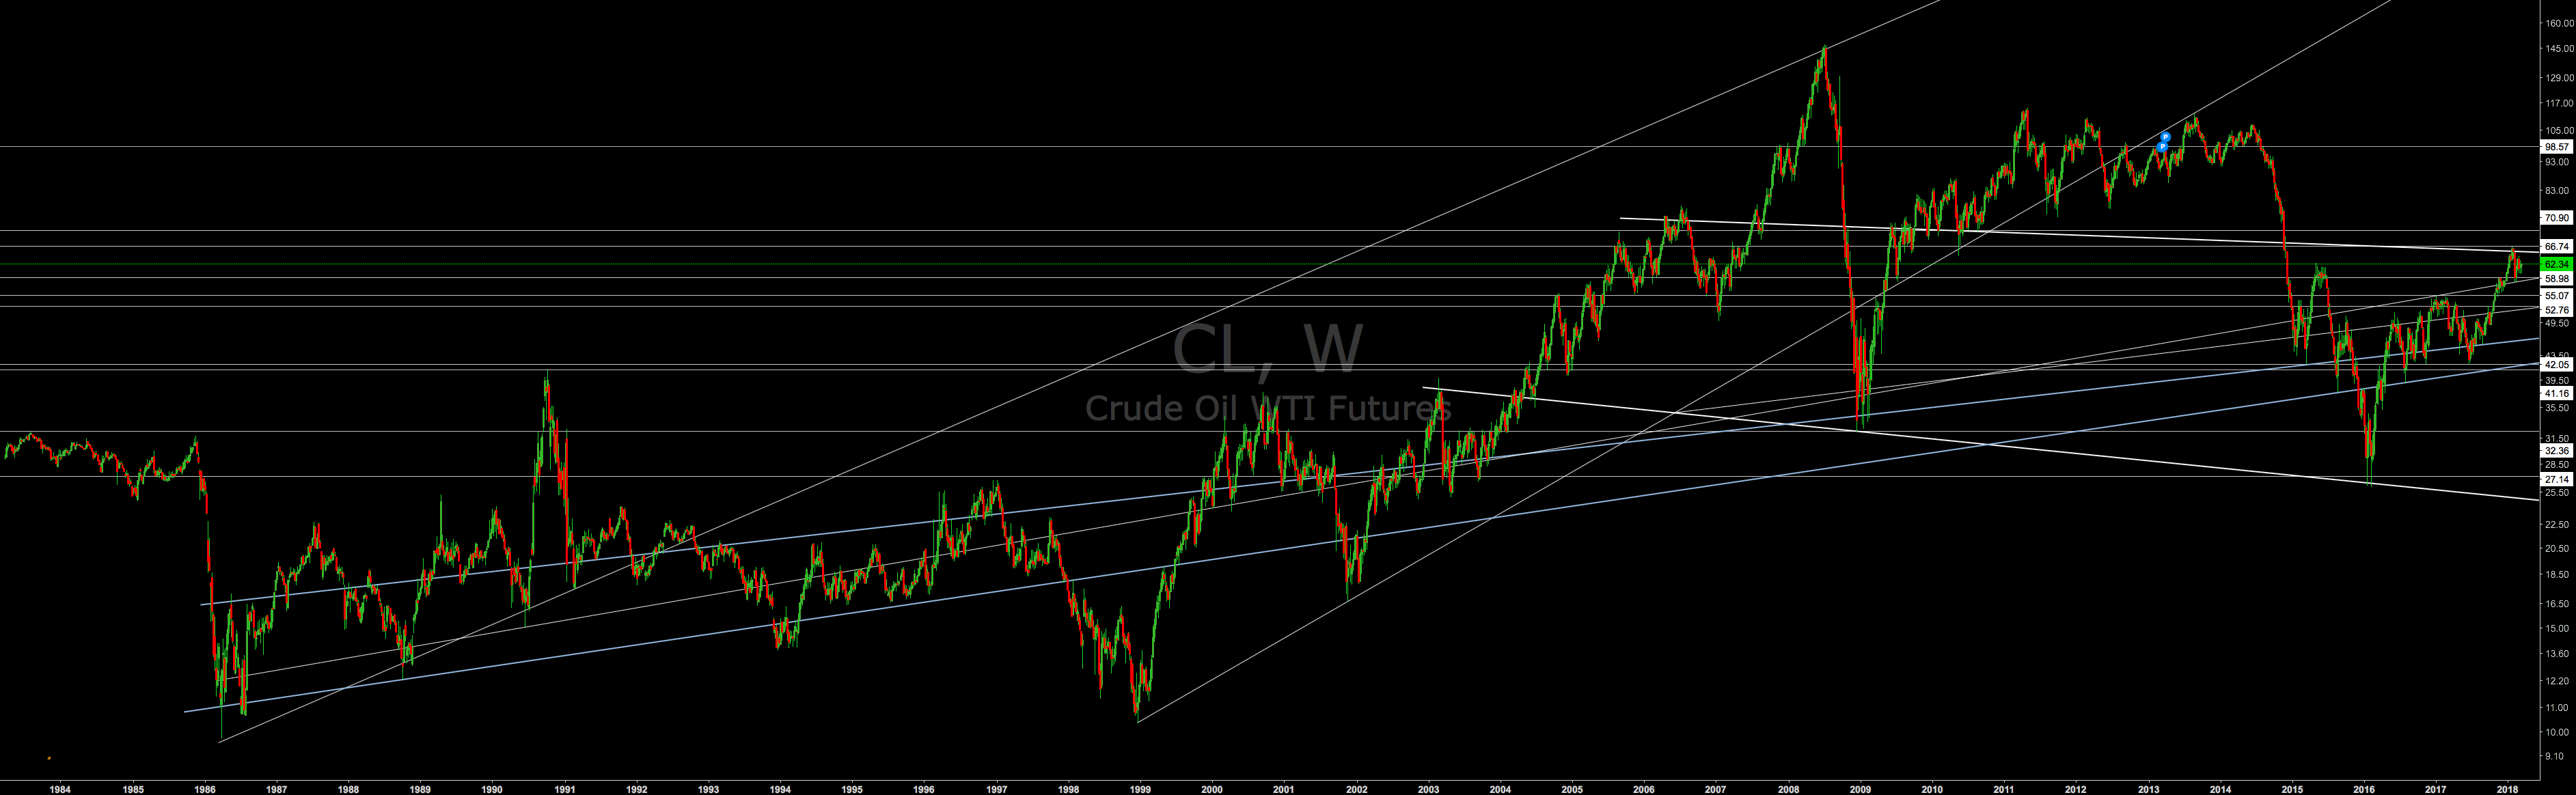
XTIUSD
This chart is from investing.com with a logarithmic scale. Way nicer than USDWTI on tradingview.com. Here is an inflation adjusted long-term Oil chart. You can't run a PC on oil so a way to 30 is a sure thing.
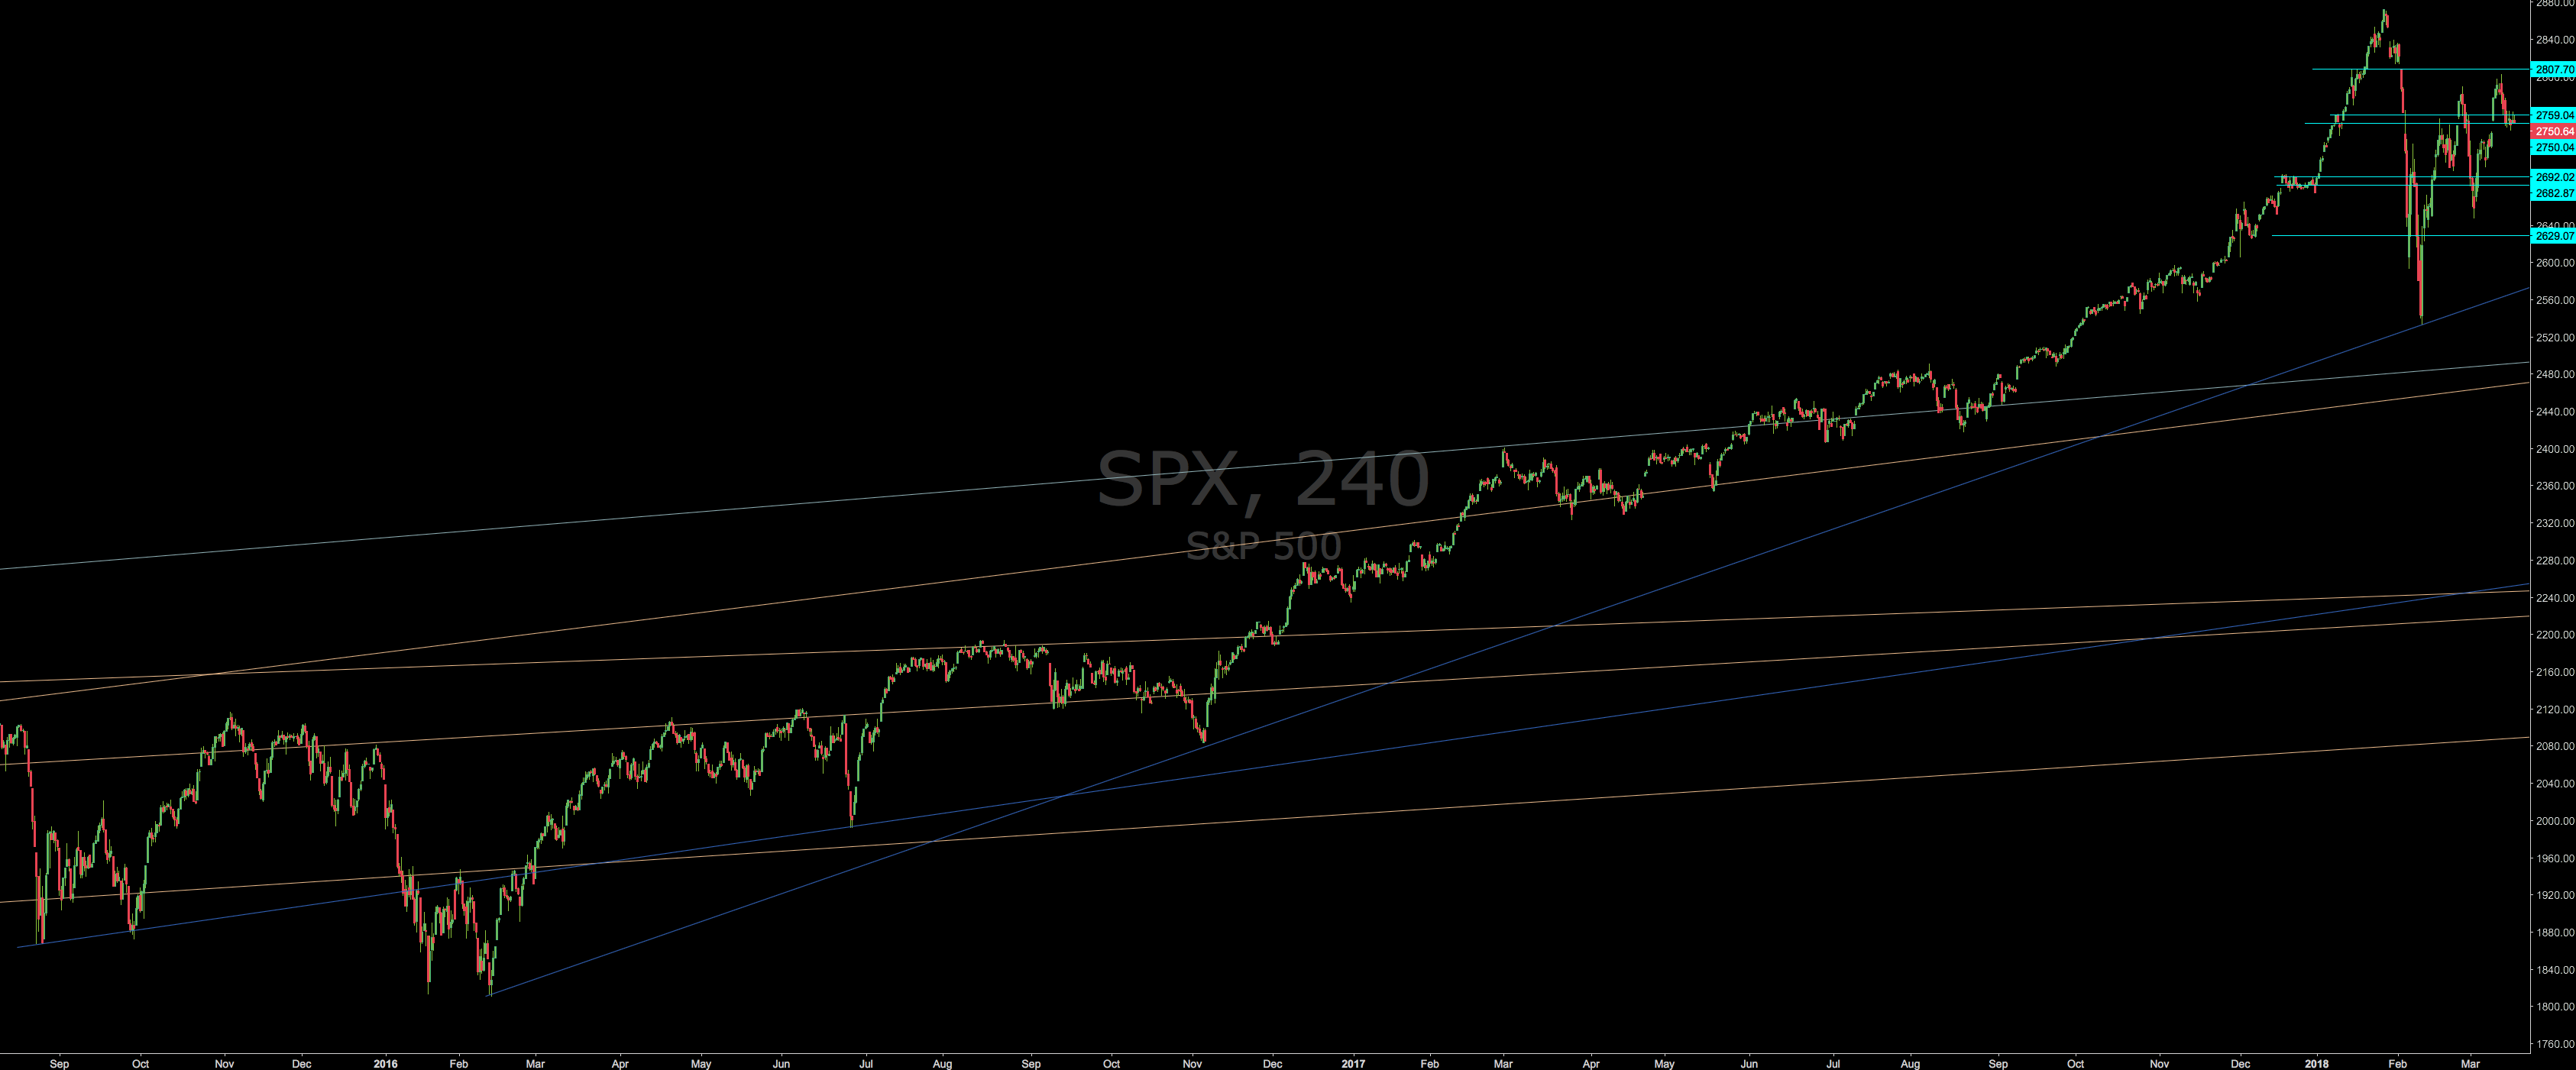
SPX
Hey recession where are you?
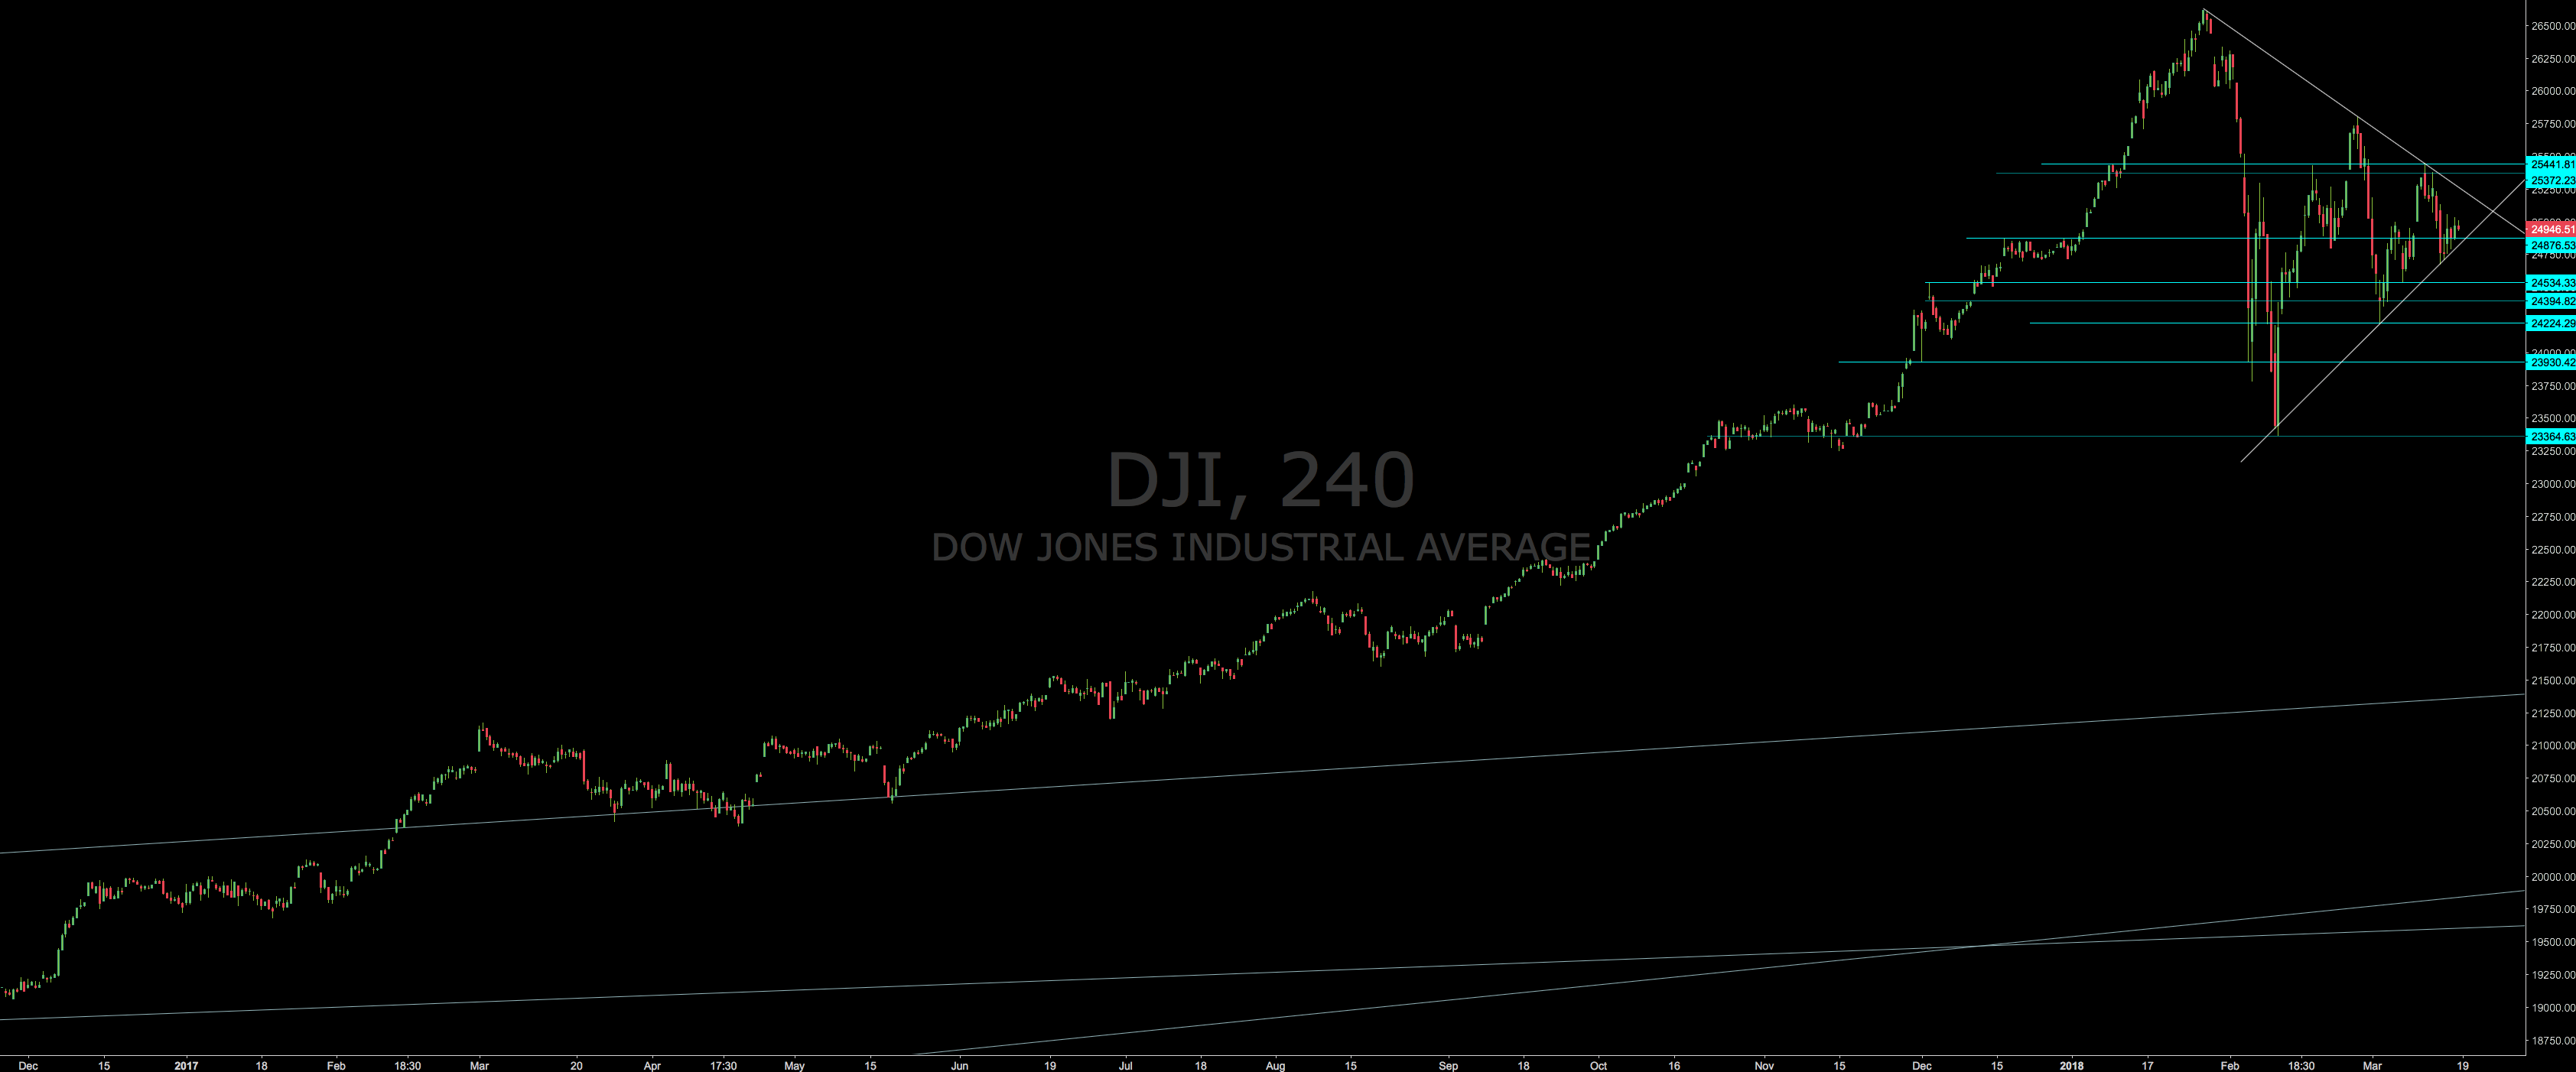
DJI
I think I am going to sell stop this.
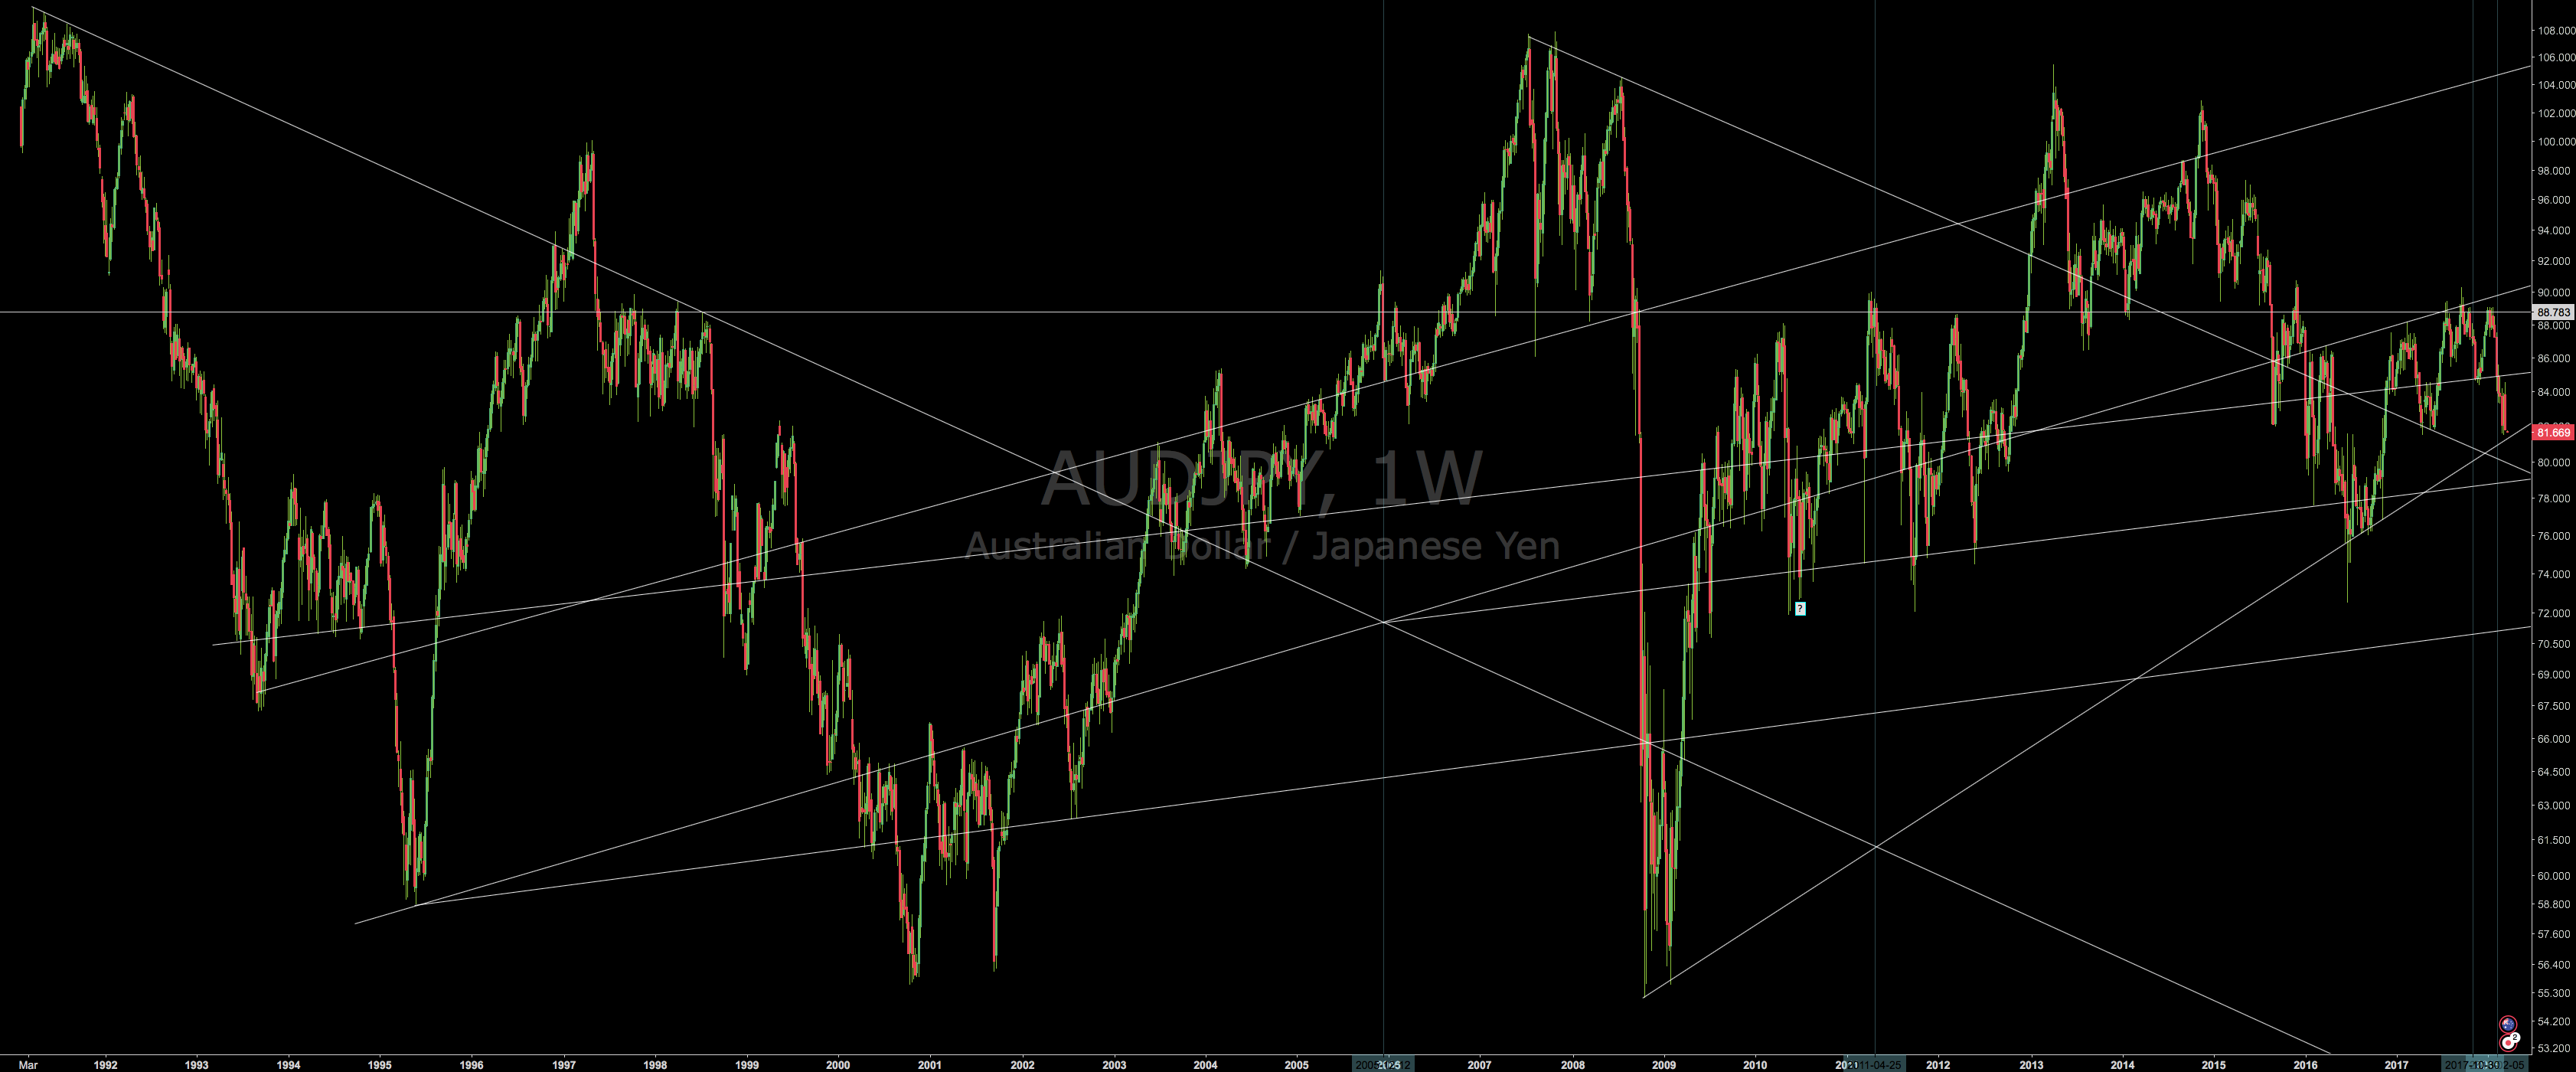
AUDJPY
JPY TA is hidden in a log scale I think.
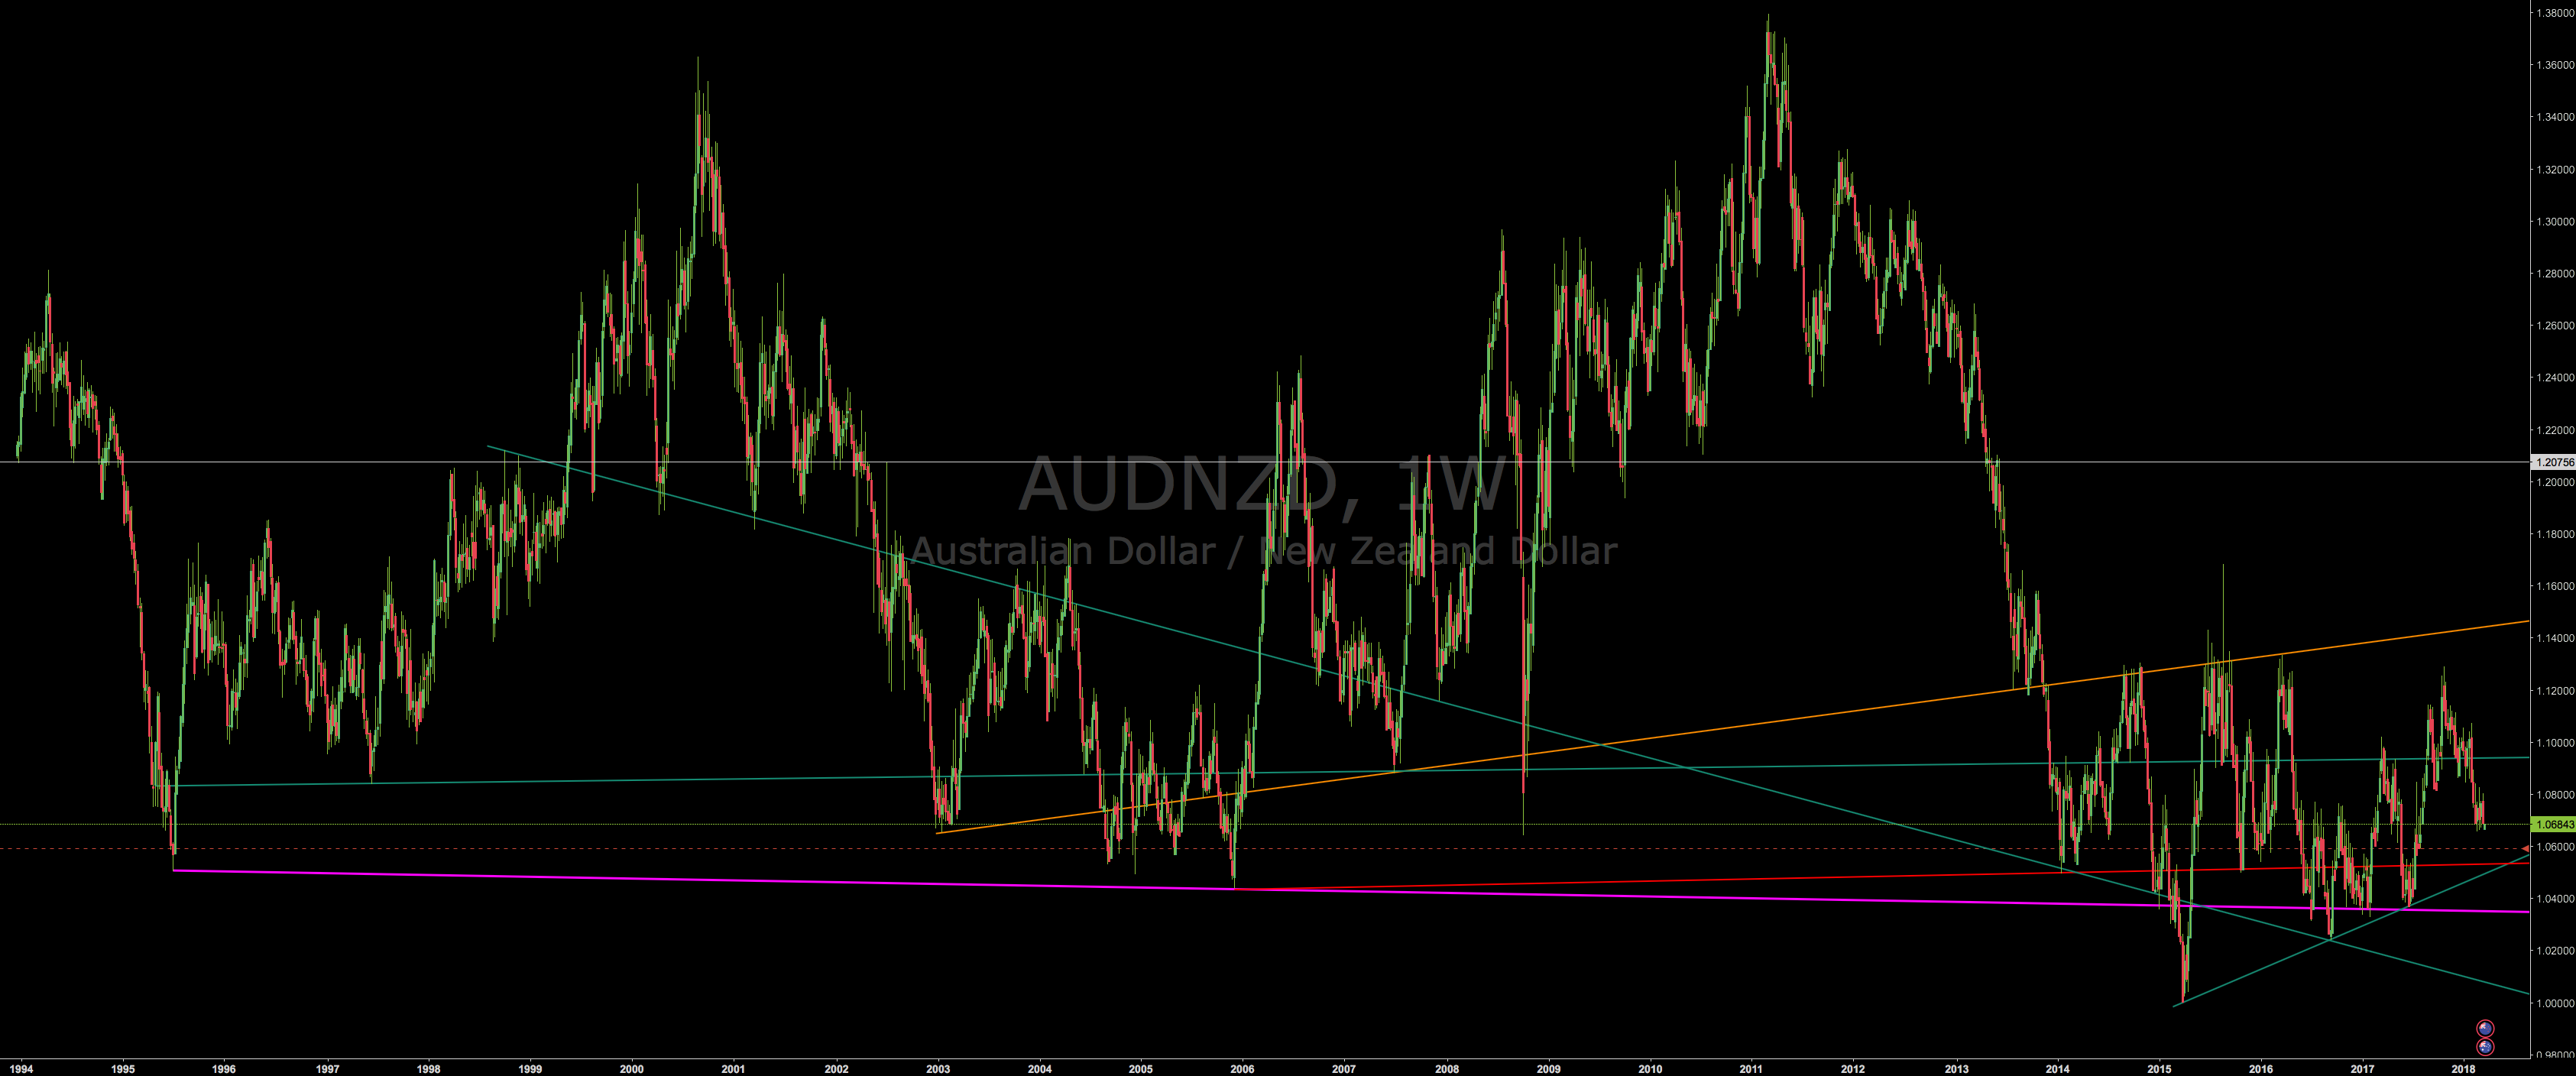
AUDNZD
Three times confirmed an uptrend. I am going to place a buy limit above the red trendline.
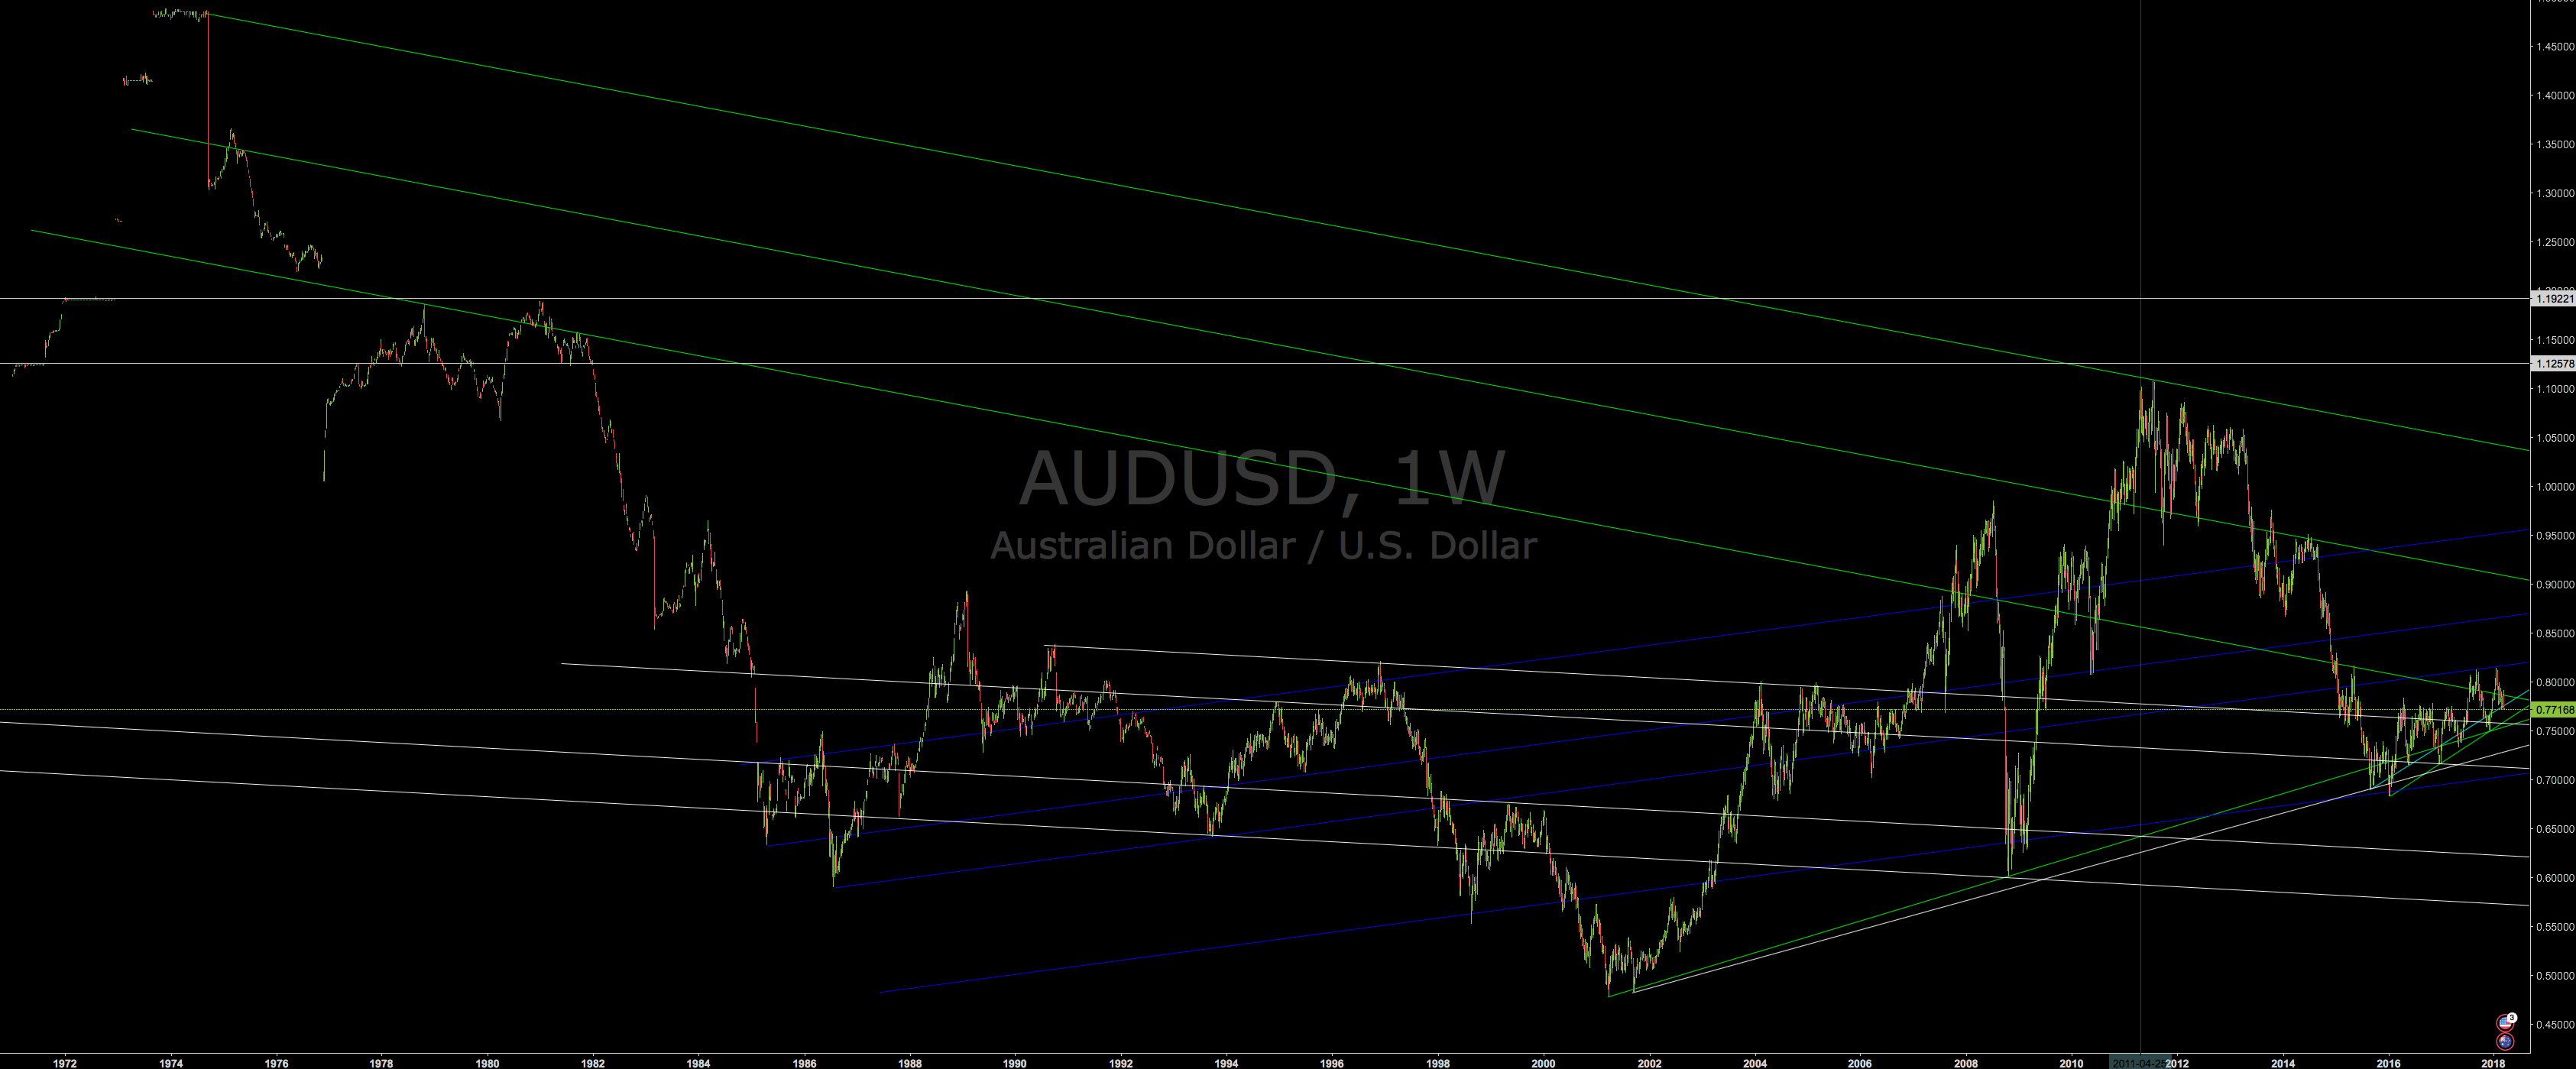
AUDUSD
Volume is necessary to confirm a trend.
Do you know any charting service with a free volume on a weekly/monthly timeframe?
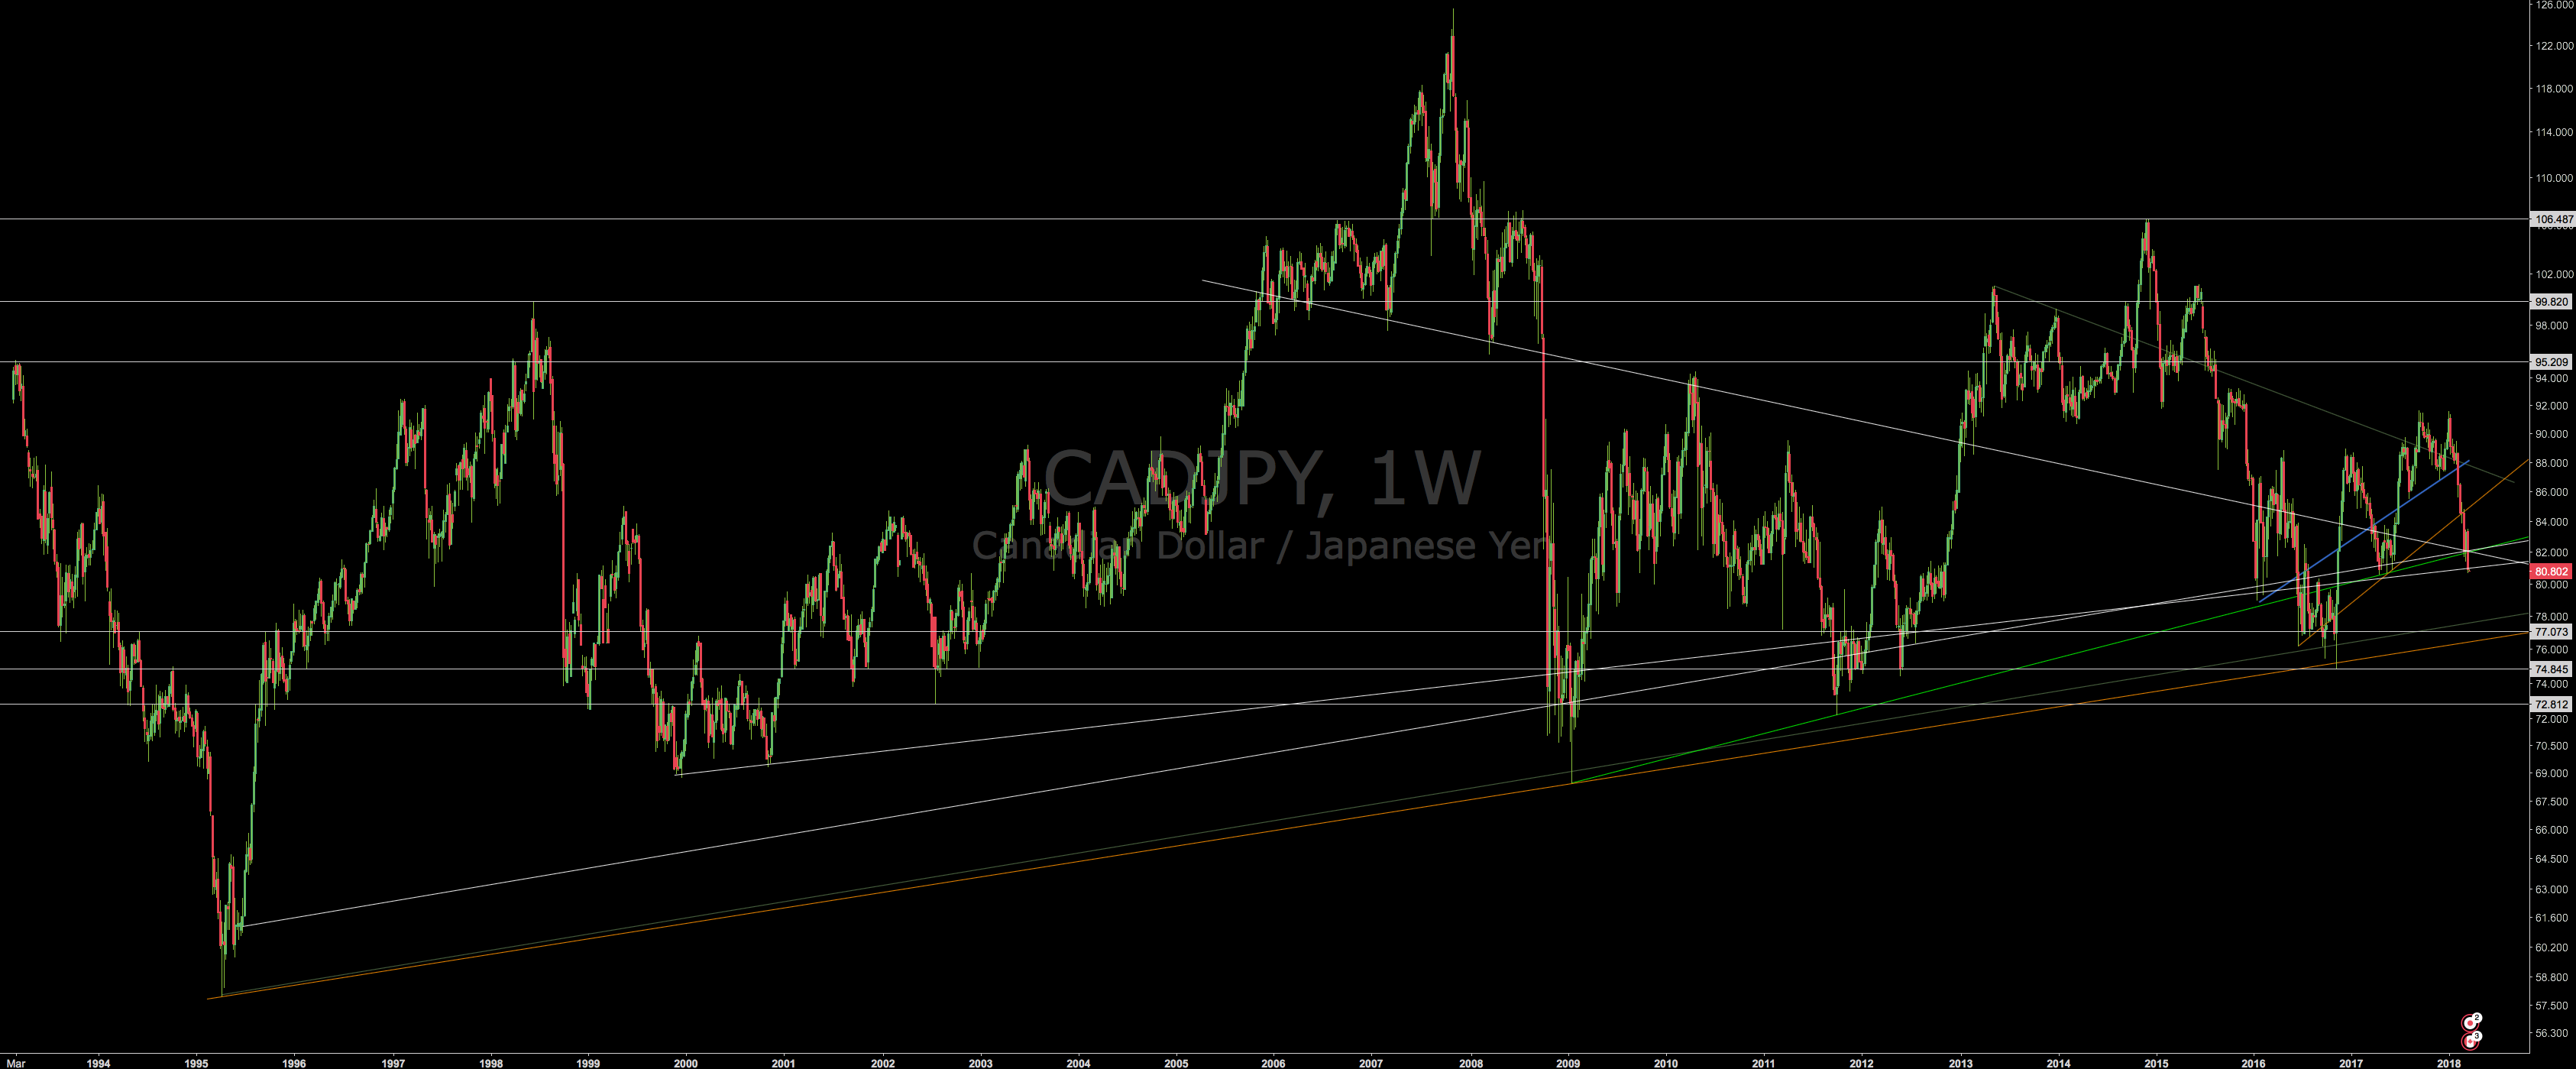
CADJPY
JPY TA definitely encrypted into log scale. Placing a buy-lambo above the orange trendline.
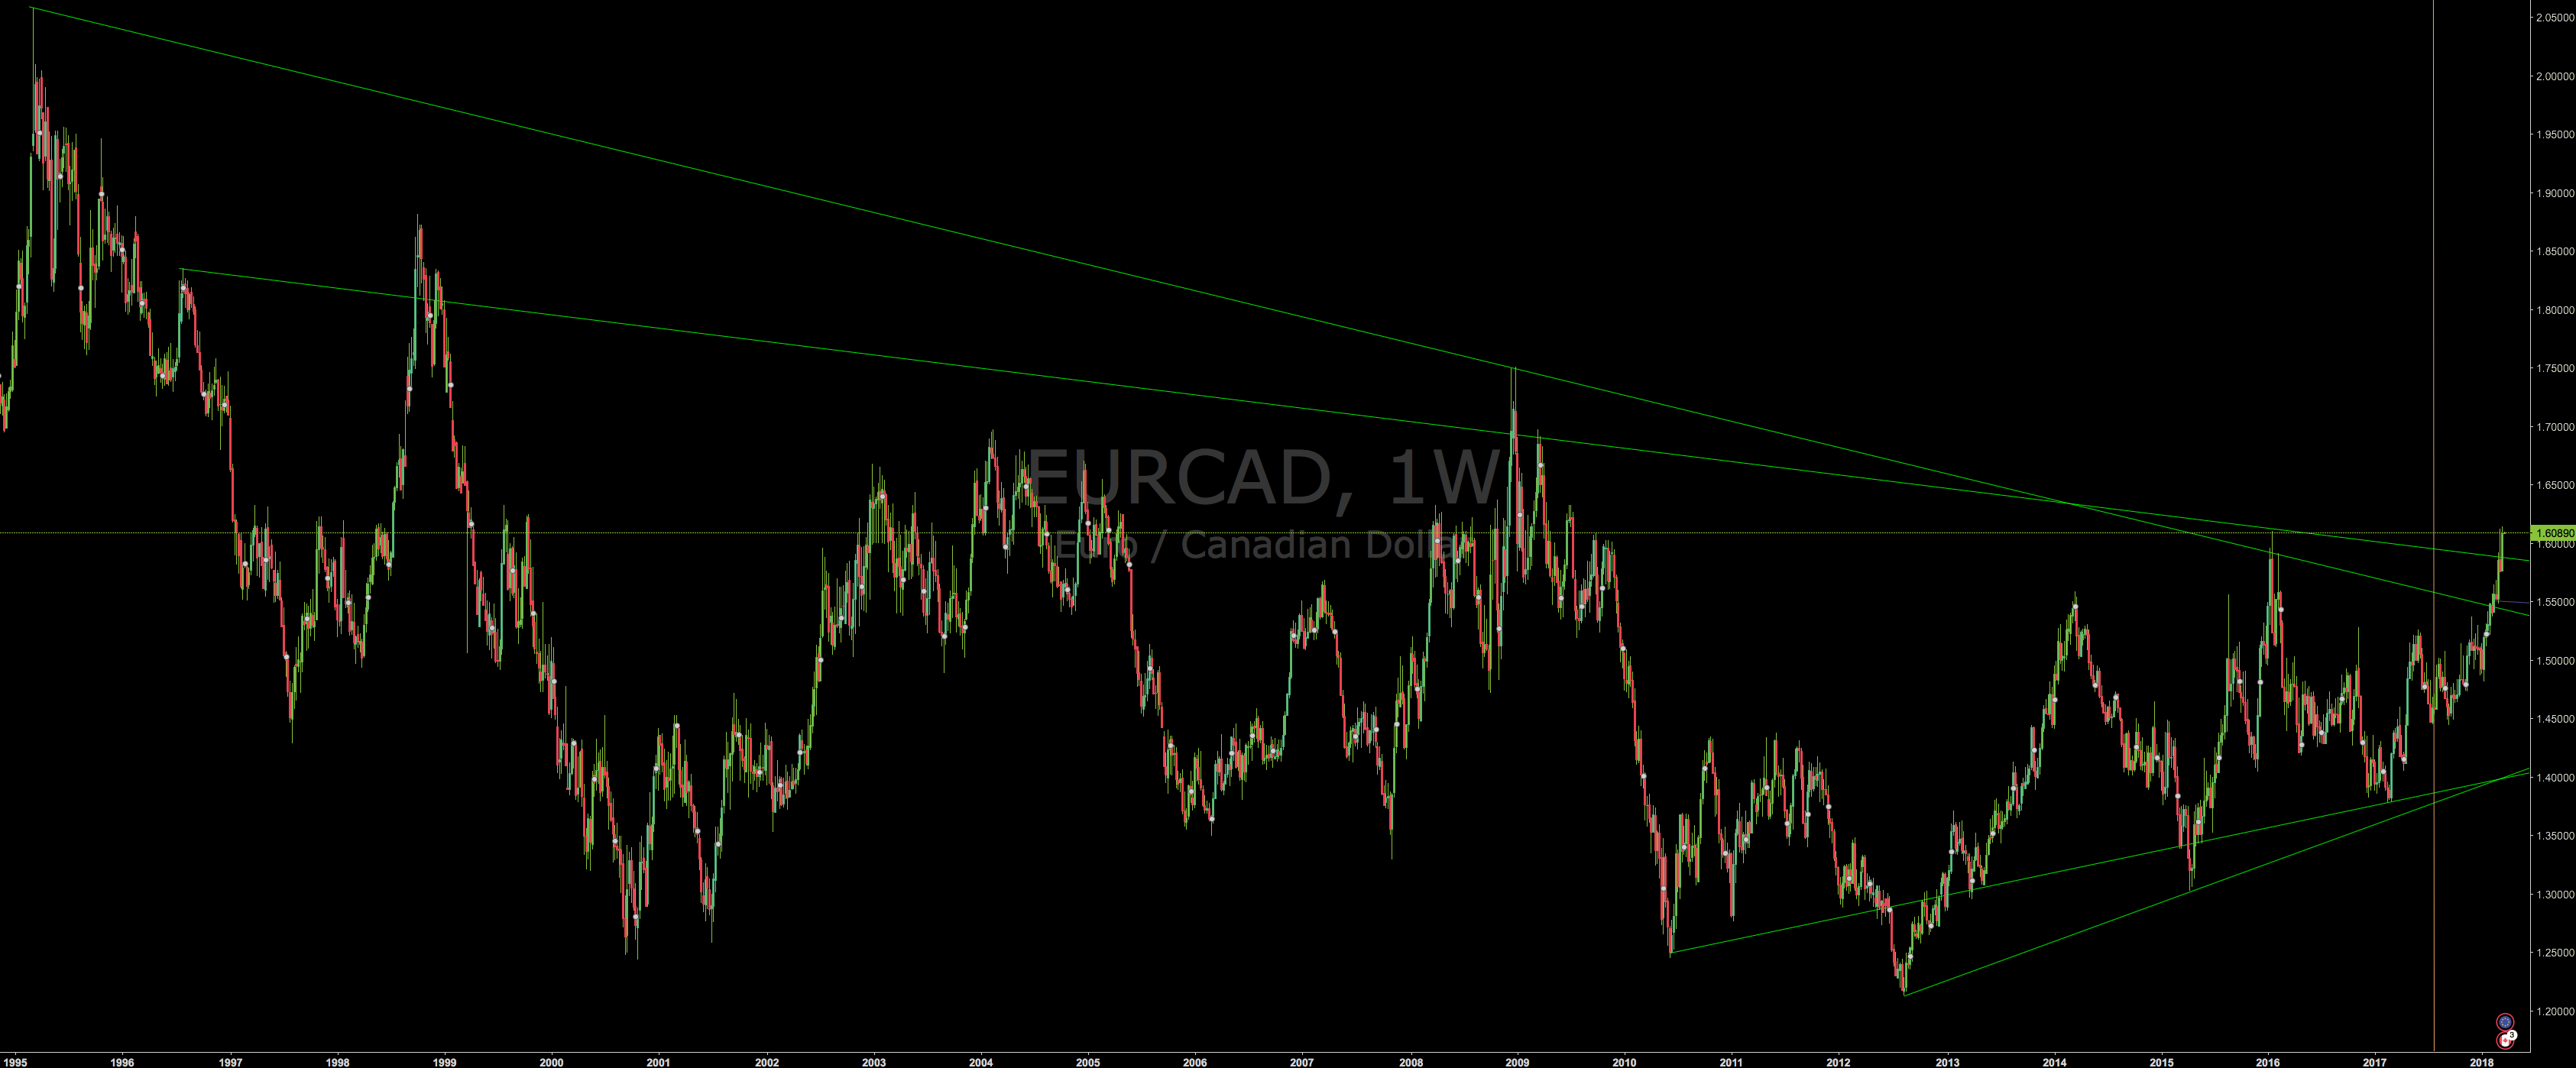
EURCAD
This looks like the best trade of my life. (investing.com)
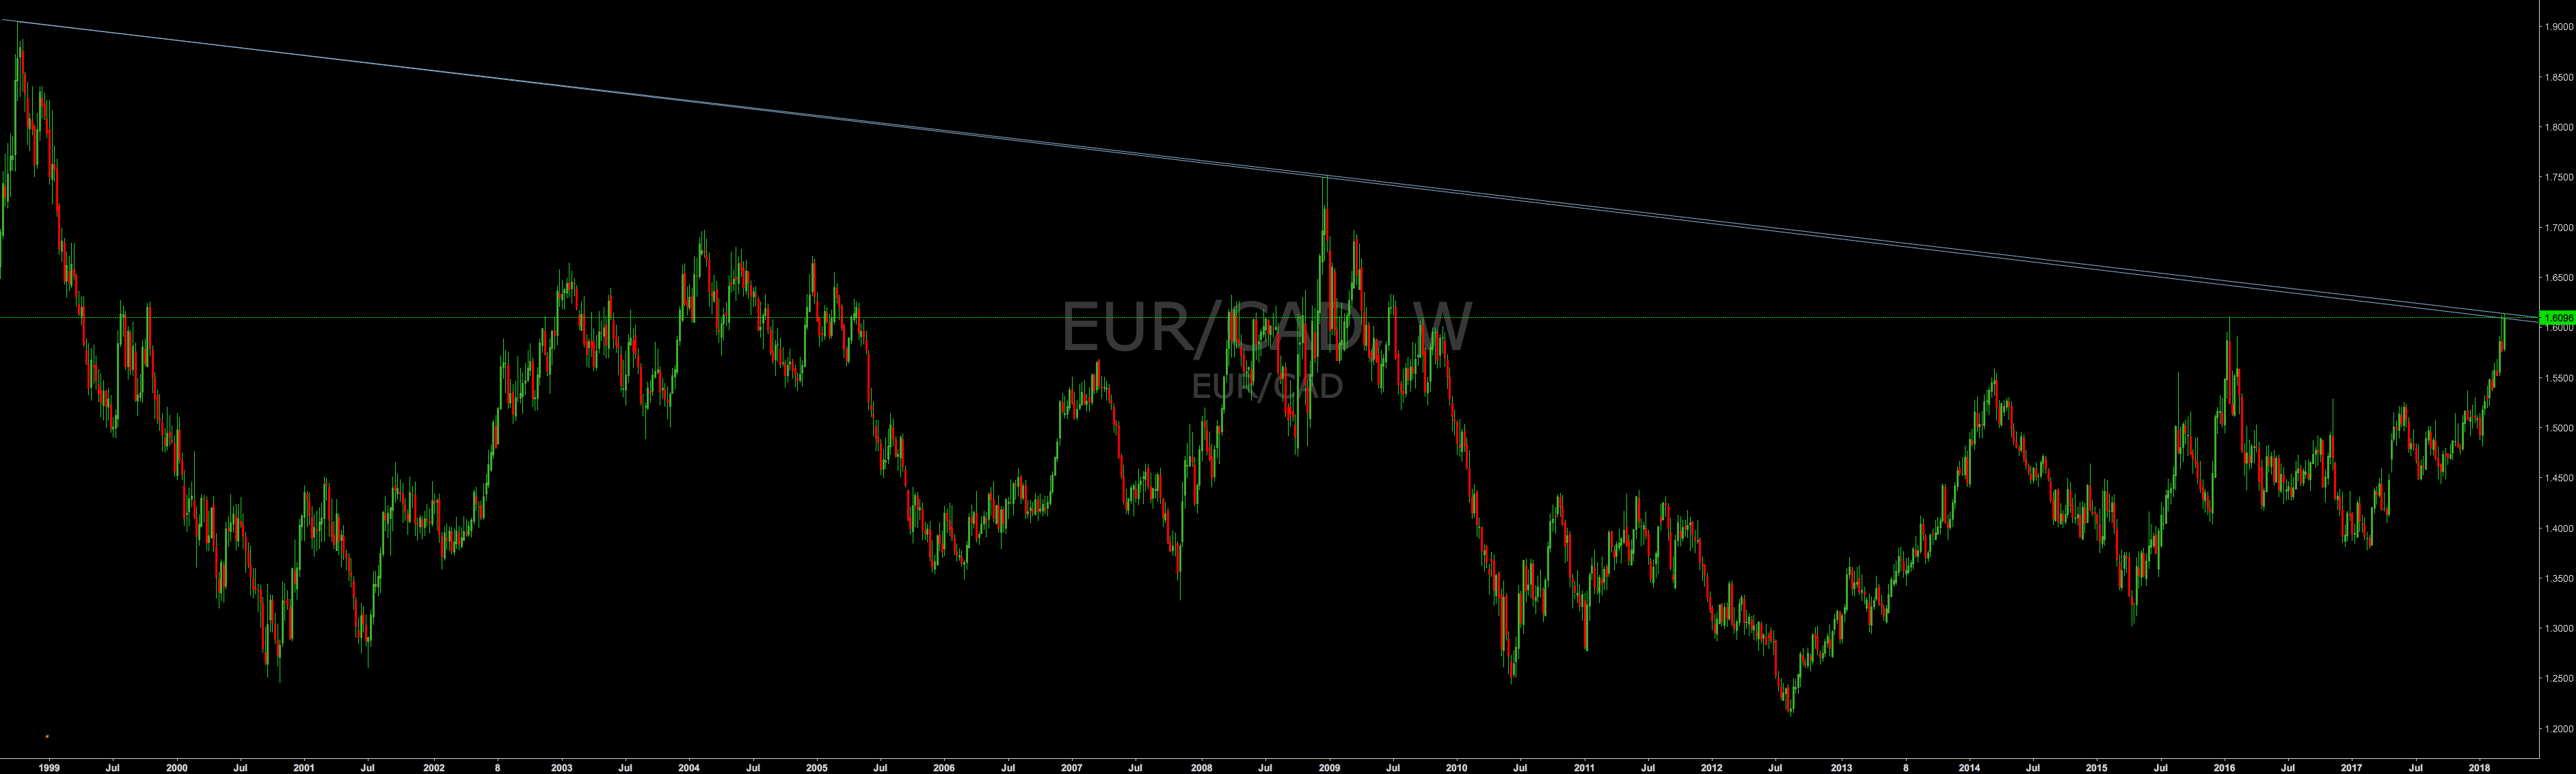
EURCAD
This looks like the best fuck off my life. (tradingview.com)
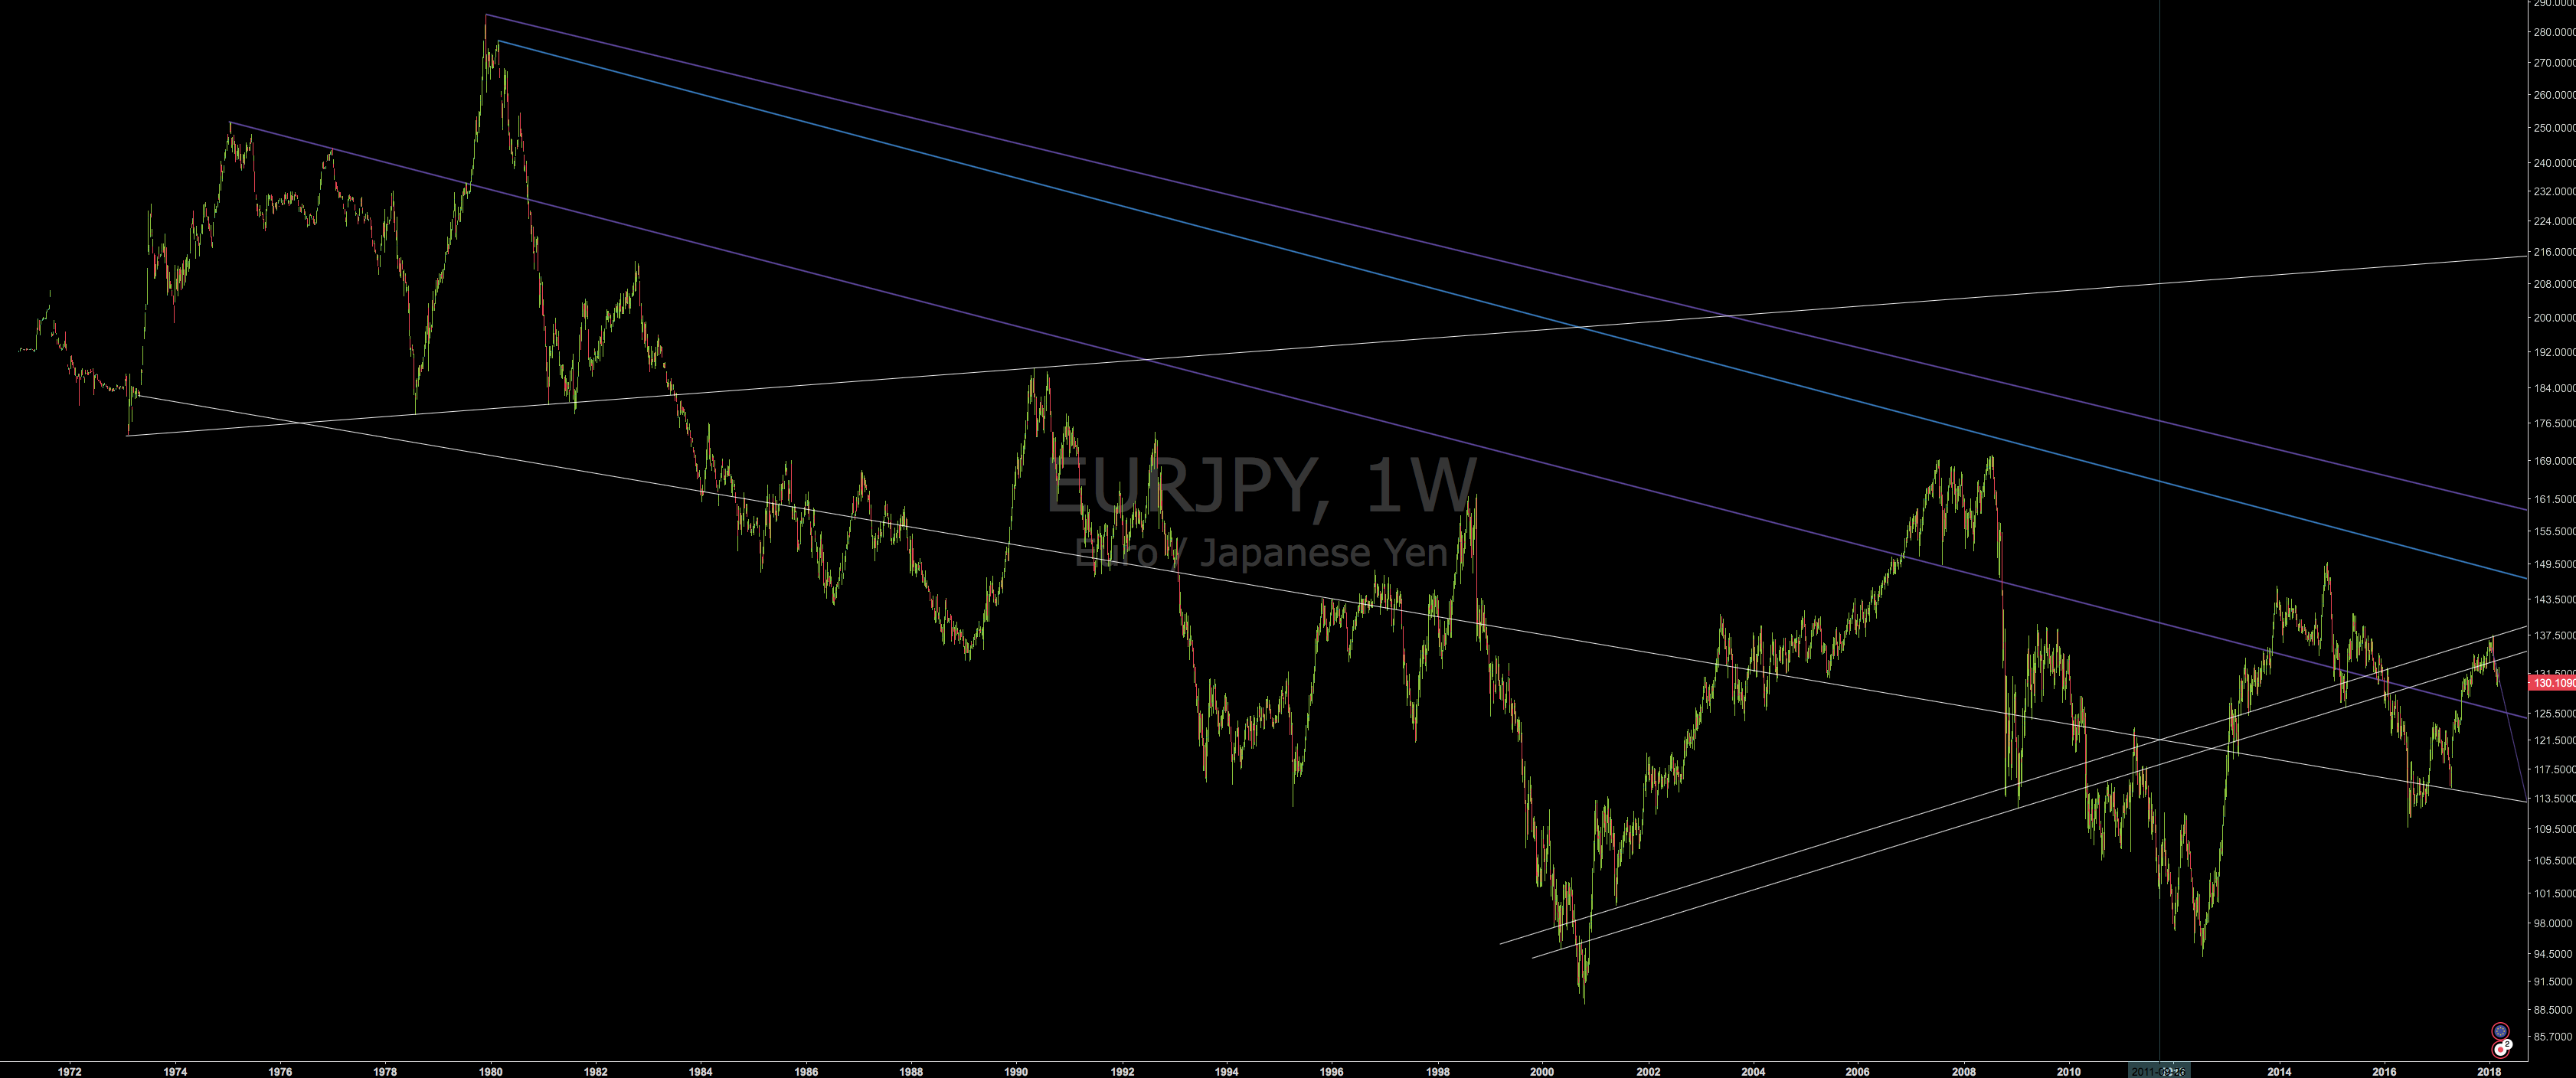
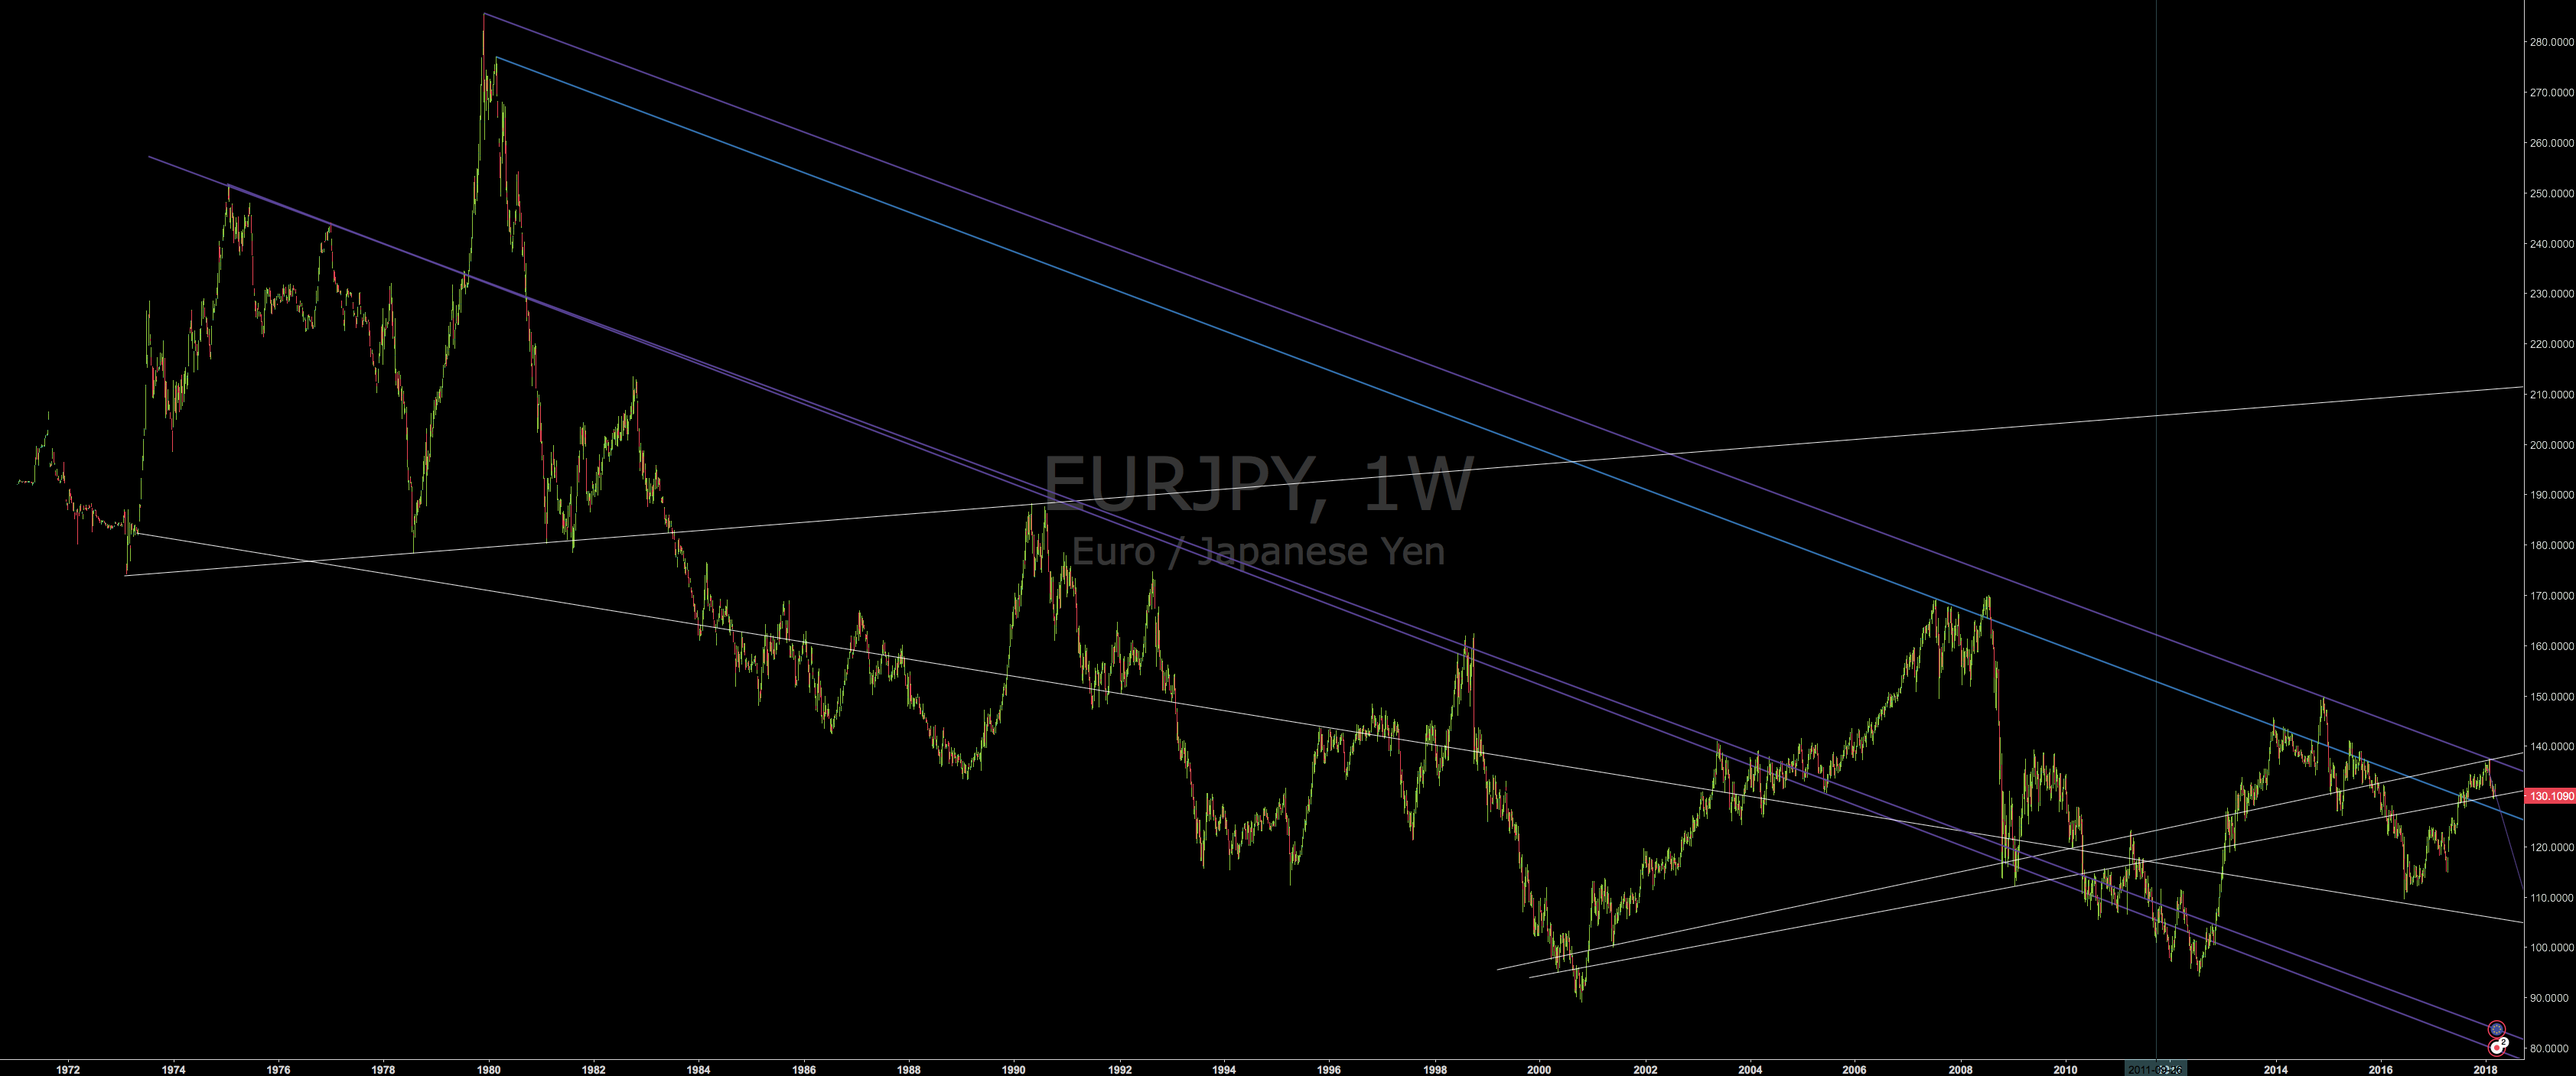
EURJPY
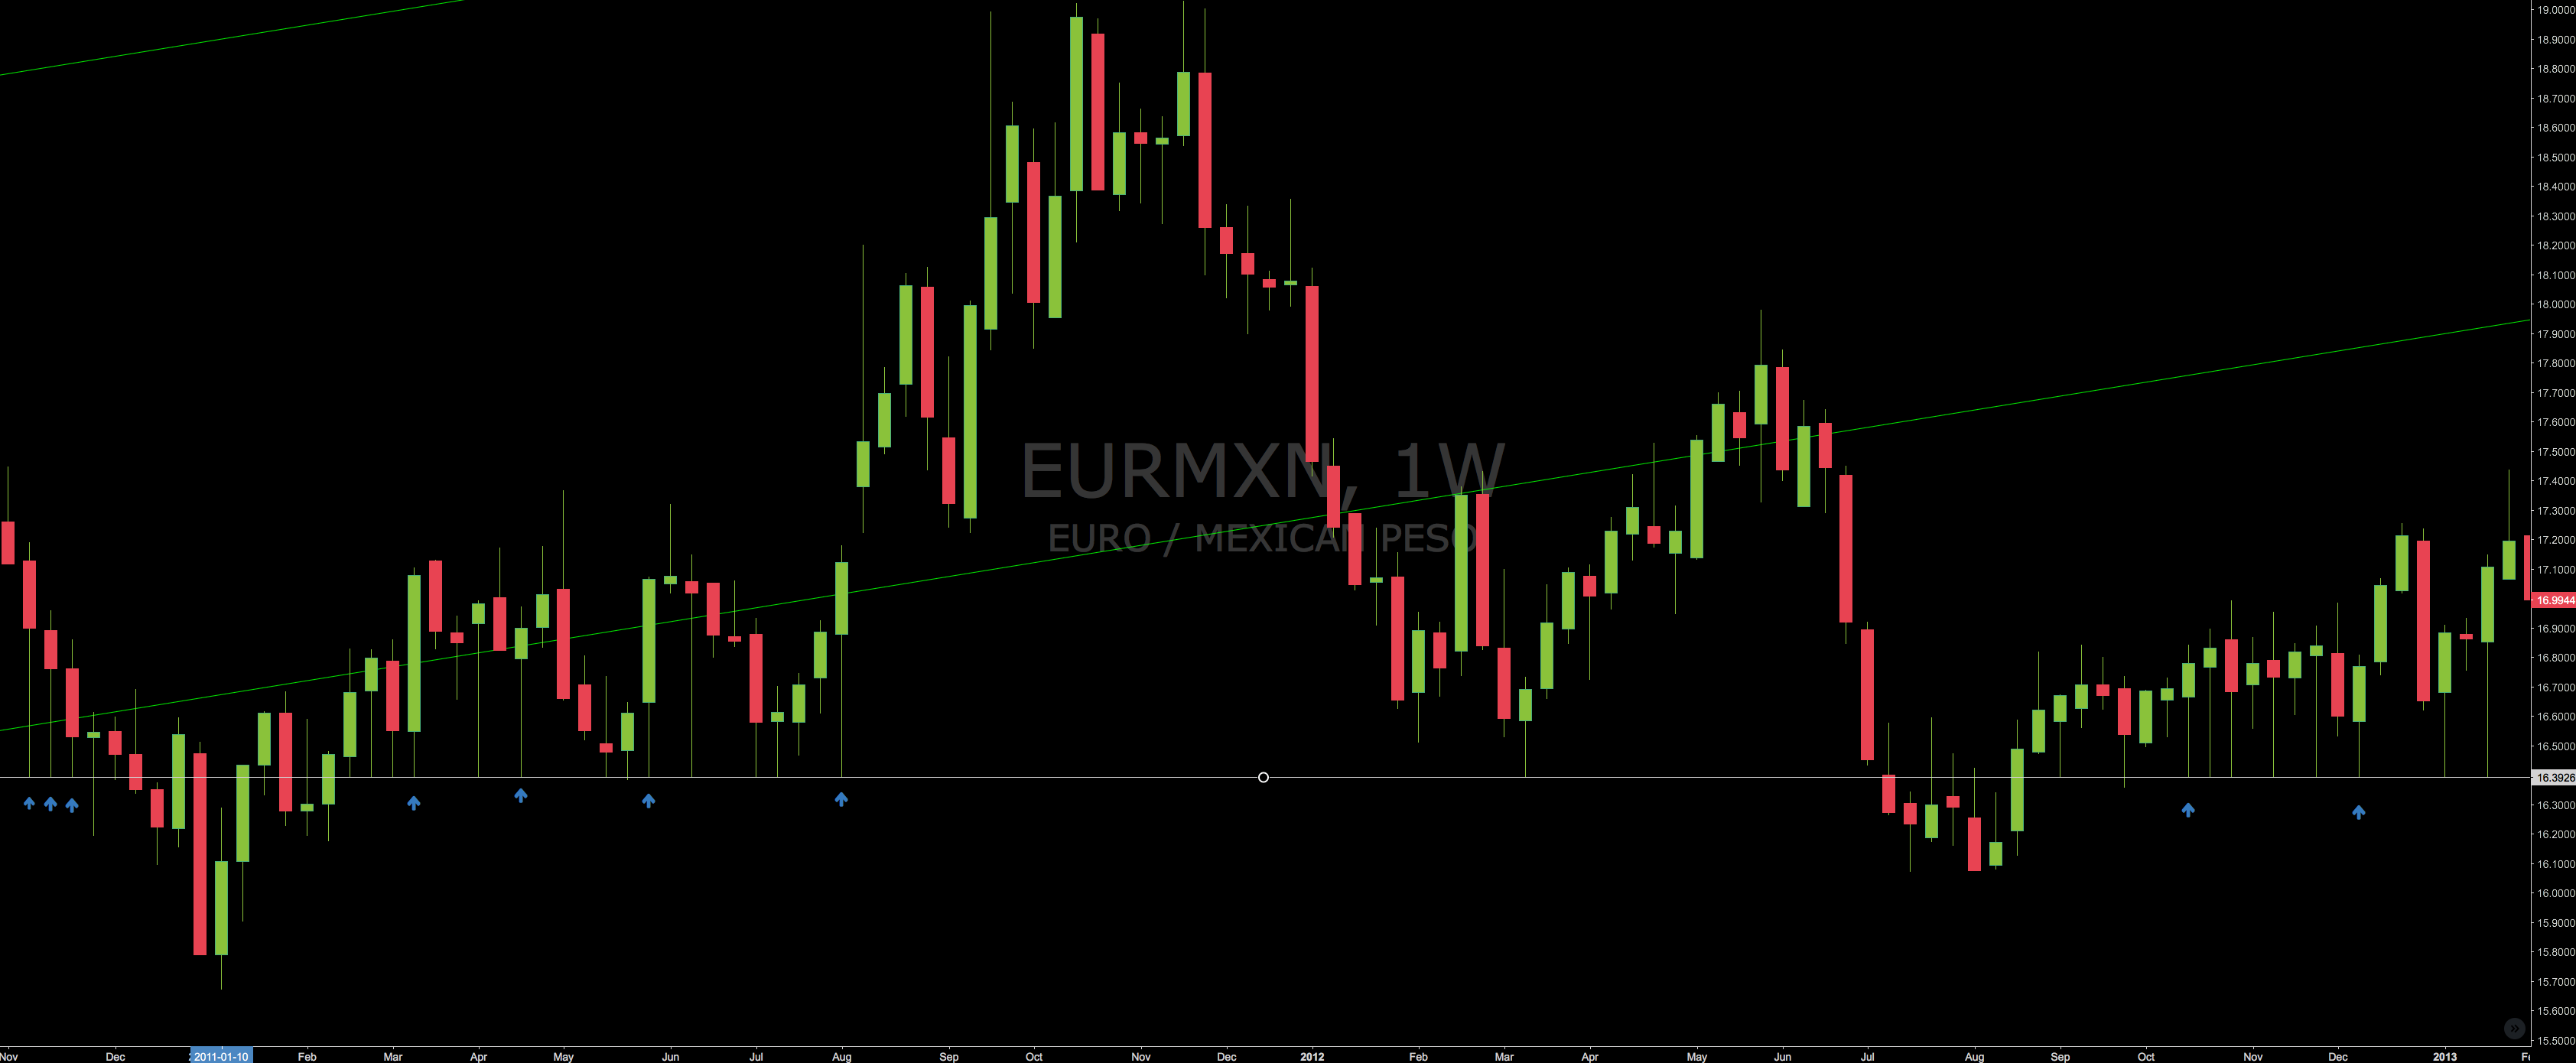
EURMXN
Lambo/week. May you please inform me when this will start happening again?
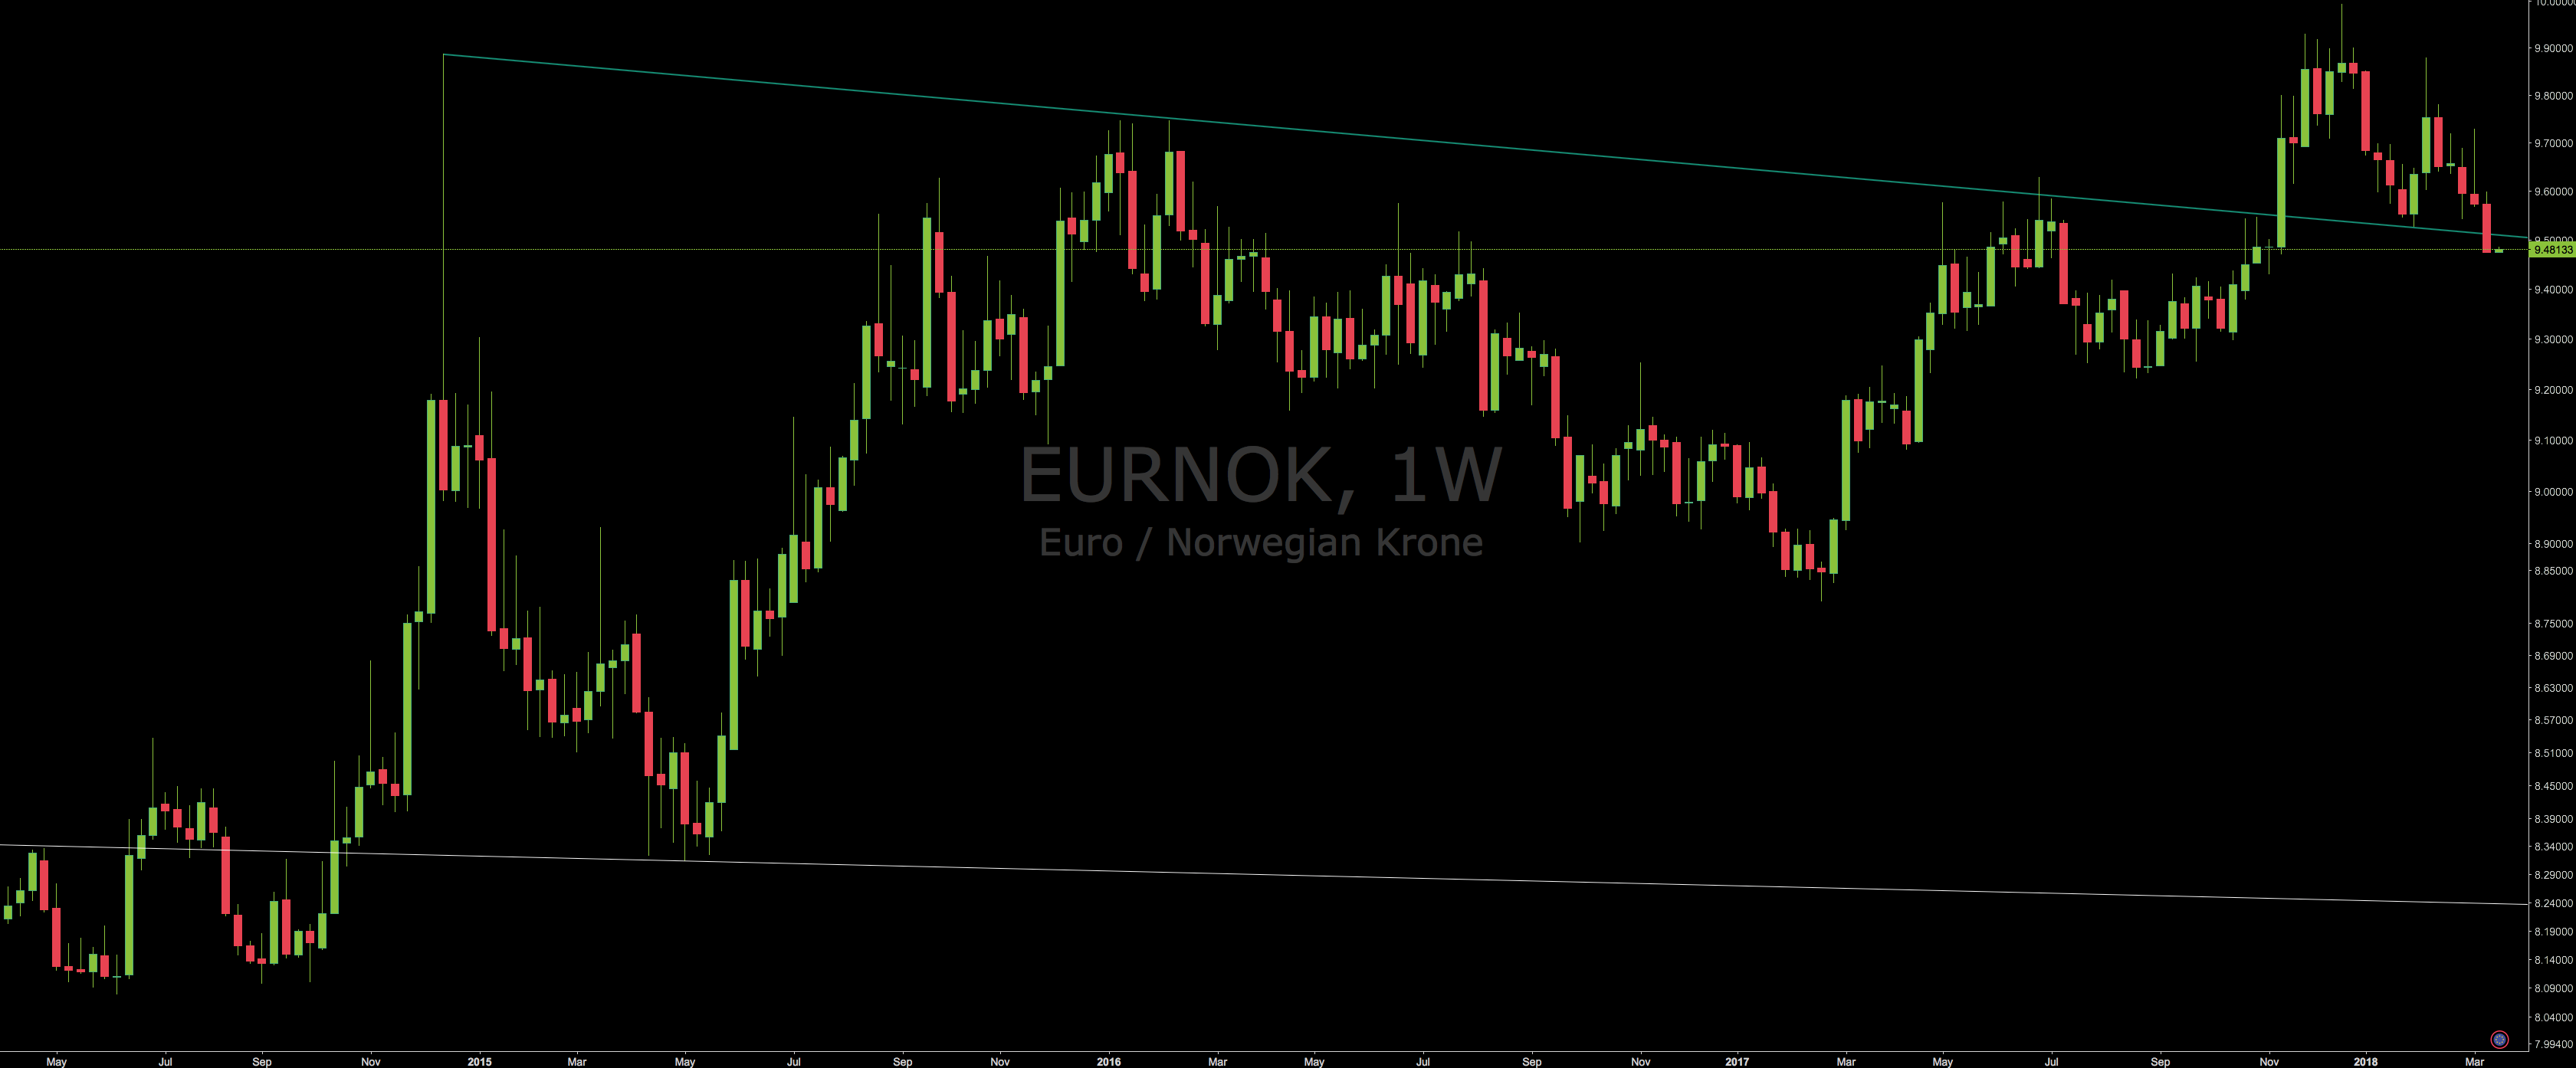
EURNOK
Sell-limit below trendline.
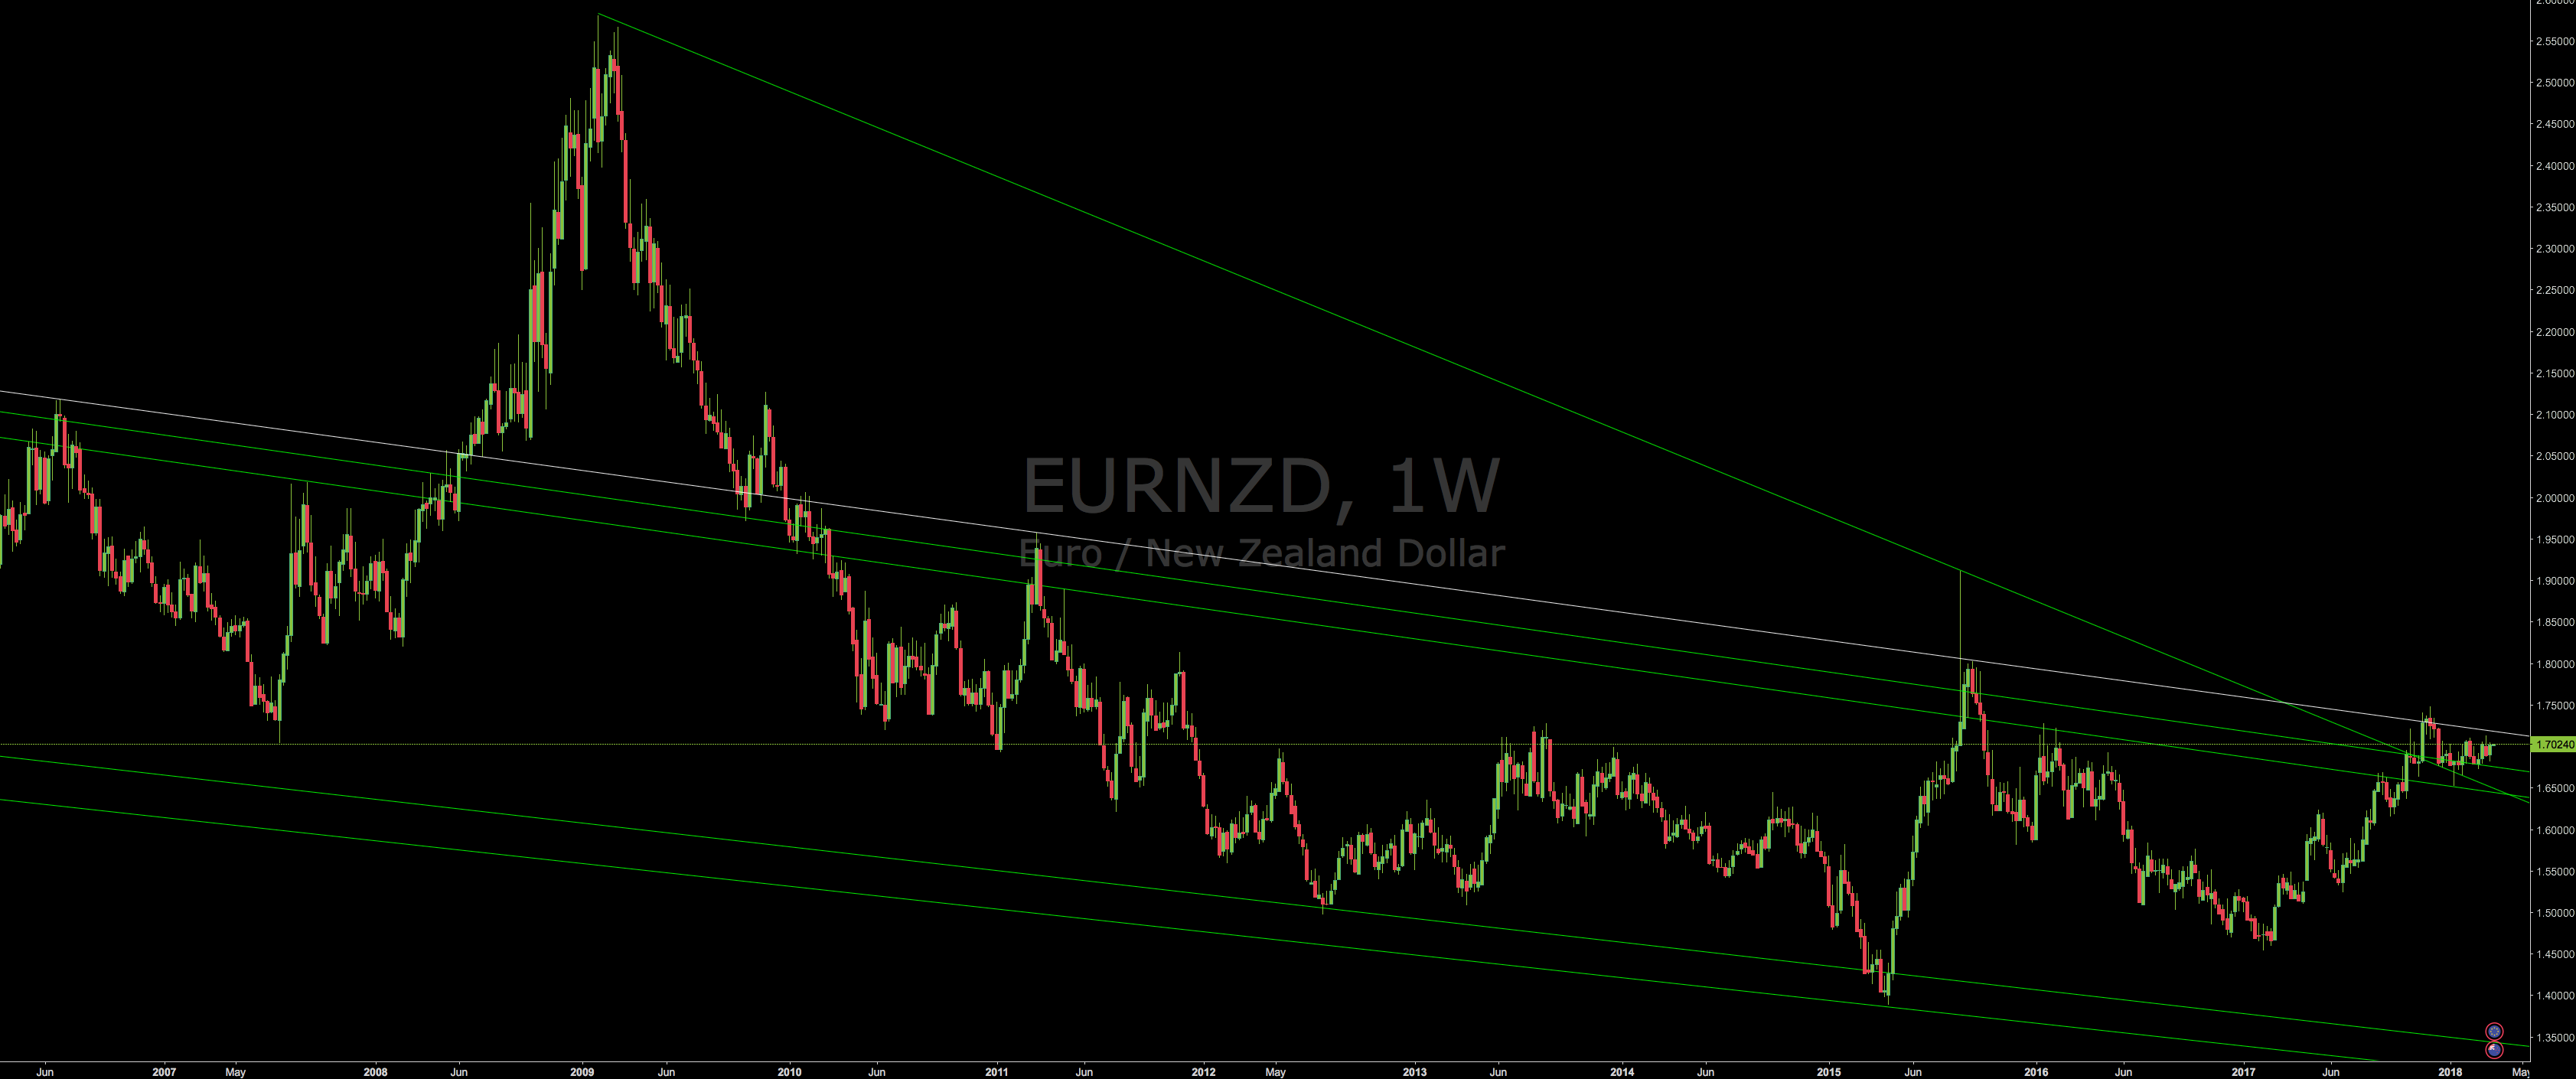
EURNZD
I am going to try to sell stop whiteline. Not sure what it will do at all.
News coming this week
- USD: Wed = Federal Funds Rate
- NZD: Wed = Cash Rate
- GBP: Thu = Bank Rate
Questions
- What is the difference between wti(short swap on Tickmill=0.27) and xtiusd(short swap on IC Market=-3.1)?
- Do you know any charting service with a free volume on a weekly/monthly timeframe?
- EUR up or down? (not sure if I should hold my EURPLN buy)
- Anyone day trading long-term trendlines?
Risk disclosure: Not a trading advice.
Sources: tradingview.com, mind