
Medium term : Resistance 2300 satoshi &2600 satoshi || Support : 2050 satoshi & 1600 satoshi
After the price action crossing the recent down trendline 1 it's doesnt react as much as the low liquidity market doesnt follow TA much. I still expect Q4 of this year or next few year would be a next crossing with the 2nd down trend line. In order to broke the down trendline from massive Descending Triangle Pattern on STEEMBTC chart.
Until it broke the 2nd down trendline. it's hardly to see any bullish outlook for STEEMBTC.
It could haste (if the price action spike) or slow (if the price keep drop) the time of approach toward 2nd down trend line depend it's volatility.
- No need for indicators as looking at larger time frame. Time will tell and pray for the whales or some News that attract 'fomo' to save STEEM/BTC value as massive descending triangle pattern might execute this asset to lower value.
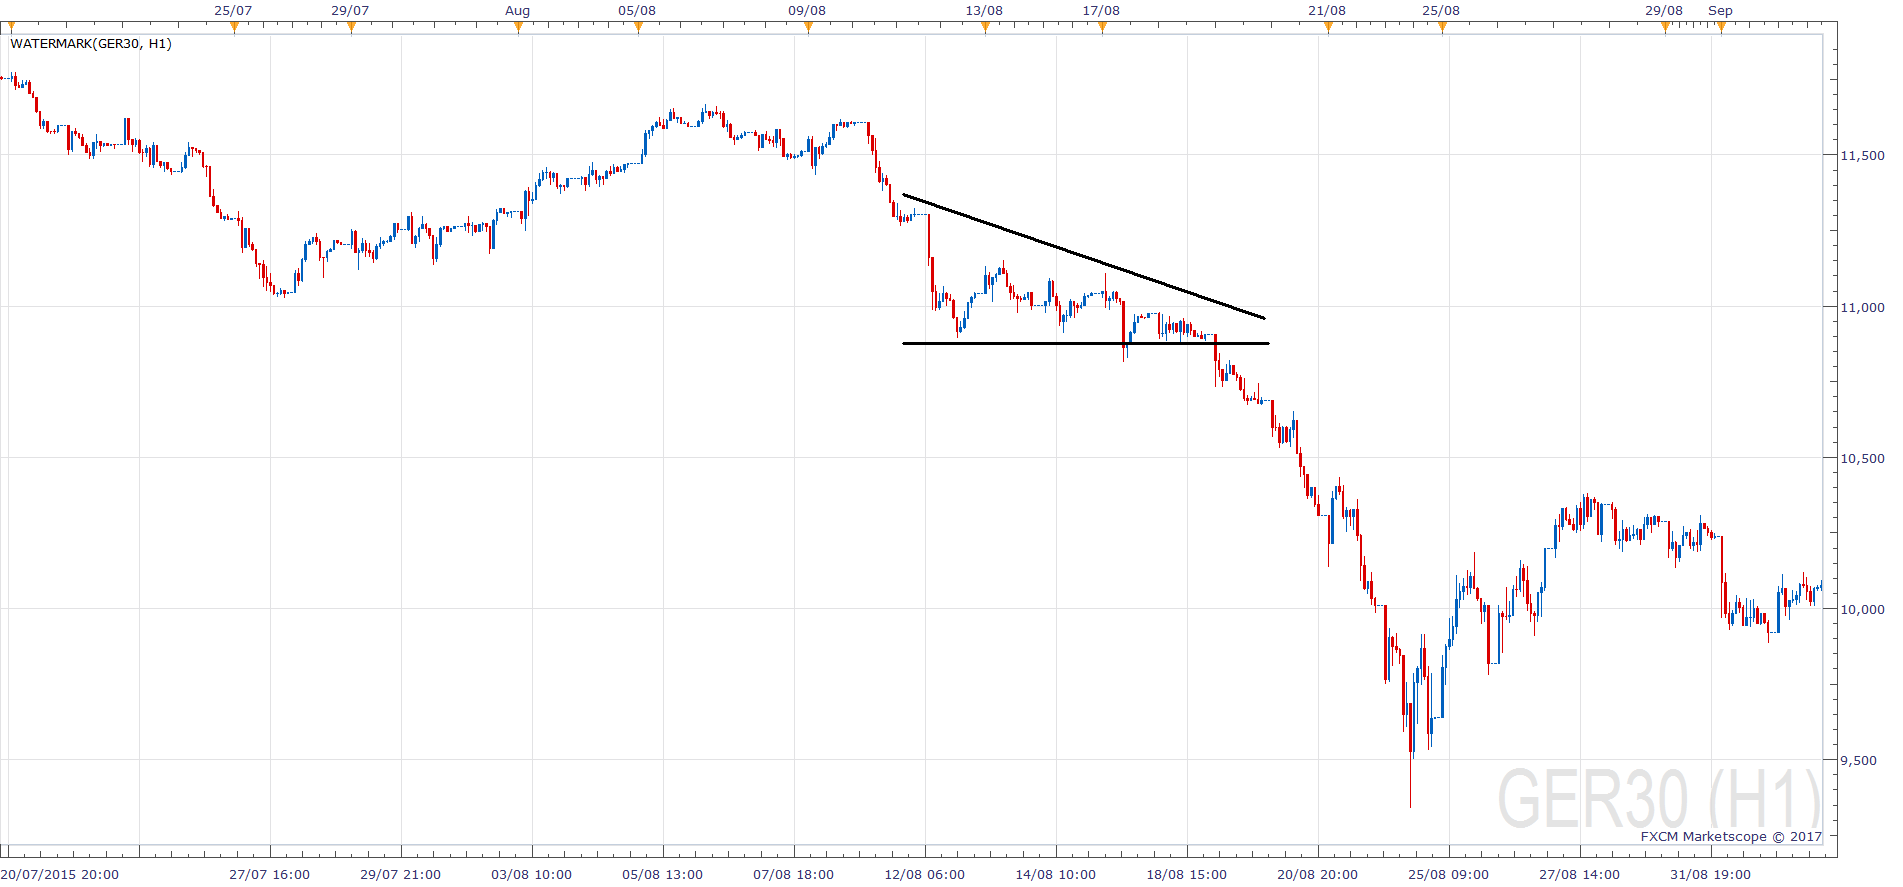
Example Descending Triangle Pattern :
Thank you for your time to read this post and please take this idea as a grain of salt as reality always differ from what i expect as this post merely just an opinion, any relation between my posts toward any of your trading decision would be on your own consequence. please feel free to share what your thought on comment section.
peace.