It is remarkable how often the number 3 shows up in technical analysis
In many trading approaches, it plays such an important role.
For example:
- some of the more commonly known reversal patterns, such as the triple top and the head and shoulders (see further), have 3 prominent peaks
- there are 3 different classifications of a trend (major, secondary, and minor) and 3 trend directions (up, down, and sideways)
- among the generally accepted continuation patterns (more on these in another post), there are 3 types of triangles (symmetrical, ascending, and descending)
3 mountain top and 3 river bottom
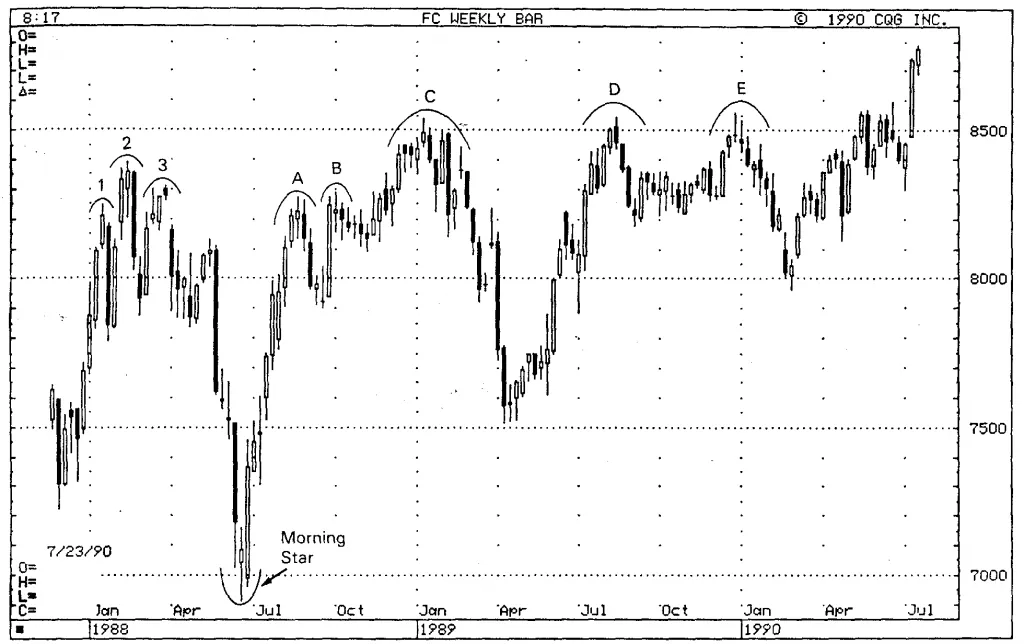
This is a similar pattern to the Western triple top. The Japanese have a 3 mountain top, which is supposed to represent a major top. If the market backs off from a high 3 times or makes 3 attempts at a high, it is regarded as a 3 mountain top. The highest point of the final mountain needs to be confirmed by a bearish candlestick indicator (for example, a doji or dark-cloud cover).Triple tops are bearish reversal patterns
Triple tops formed when the price, which is trending upward, tests the same resistance level without breaking through and each time falls to a similar support area. The pattern is considered complete when after the third decline the price falls through the support level. So, the price is expected to move in a downward direction indicating a sell signal.The example below with several 3 mountain tops clearly illustrates 3 pushes to new highs and after the third failed push, the bulls surrender.
Example of 3 mountain tops
Triple bottoms are bullish reversal patterns
Triple bottoms share the same features as the triple top, but this time they signal a reversal of a downward trend. They indicate that a price that is trading in a downtrend and tries to fall through the support level for 3 times, each time moves back to the resistance level. The pattern is complete when the price moves above the resistance level and begins to trade in an upward trend.
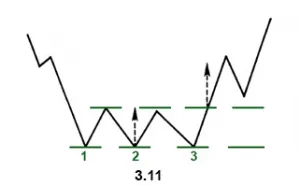
Triple bottom or 3 rivers
If the central mountain of a 3 mountain top is the highest mountain, it is named a 3 Buddha top, a perfect analogy to the head and shoulders pattern in Western technical analysis terminology.
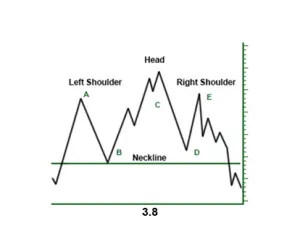
Head and shoulders pattern or 3 Buddha top
The head and shoulders top is considered as the most reliable of all reversal patterns
Formed in an uptrend, the head and shoulders pattern signals that the price is going to move in a downward direction.
The price moves as follows:
- rises to a peak and declines
- rises again, but this time higher than the first peak, and declines
- rises, but not so high as the second peak, and declines
Inverse Head and Shoulders
This pattern is also called head and shoulders bottom and is exactly the opposite of head and shoulders top. In Japanese terminology, this is called an inverted 3 Buddha. It signals that an upward move will arise. This pattern is considered complete when the price breaks above the neckline.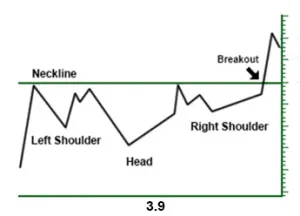
Inverse head and shoulders
In Japanese candlestick charting a confirmation of the trend reversal for the 3 river bottom to provide a buy signal, is that there should be a close via a white candlestick above the peaks of the troughs.
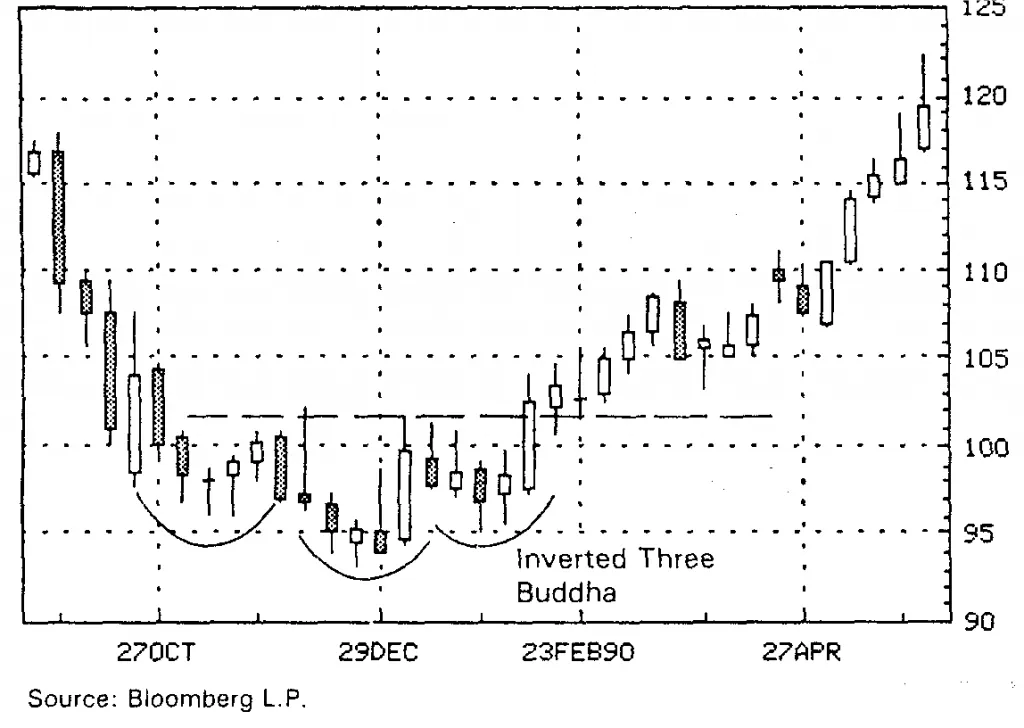
Example of an Inverted 3 Buddha with a white candlestick close
Double Tops and Bottoms
These are again well-known chart patterns which show an attempt to continue an existing trend. But after a few attempts to continue the direction, the trend is reversed. By their formation, these patterns often resemble the letter W (in case of a double bottom) or the letter M (in case of a double top).
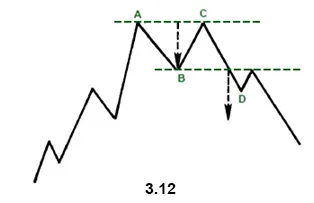
Double top signaling the weakening of the preceding upward trend
Note that the double top pattern is not complete unless the price breaks down the support level (D) signaling the beginning of a downward trend.
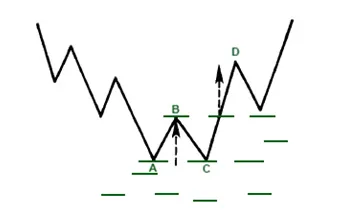
Double bottom which signals a reversal of a downtrend
It is important to note that for the double bottom the price should break through the support level for a trend reversal to take place (changing from a downtrend into an uptrend).
This completes our overview of major reversal patterns in our HitBTC technical analysis course. In the following post, we will illustrate continuation patterns.
Sources:
Japanese Candlestick Charting Techniques (by Steve Nison)
Technical Analysis Explained (by IFC Markets)
Posted from my blog with SteemPress : http://companywebsolutions.com/the-significance-of-the-number-3-in-technical-analysis/