On my previous posts about AgX, I have first extracte STEEM/SBD data to calculate their 200 days moving average (AgX factor), and then used this data to draw a chart of the evolution of the price ratio and of the AgX factor itself.
The task was then run manually with npm run start
New Features
- In order to automatize the whole thing I have integrated Express.js framework and set the main route to start fetching data and drawing the chart.
- The call to the the job is secured by a secret token
- If a chart has already been drawn that day, the process aborts
- If a chart has already been drawn that day but the admin wants to override, he can add the parameter
force=trueto the URL
The new flow is as follow:
- API is called
- Authentication is checked thanks to the token
- If Authentication succeeds, check if the chart has already been drawn
- If the chart has not been drawn yet or if the admin forced it, get data from Bittrex API
- Calculate 400 days STEEM/SBD ratio and 200 days AgX factor
- Draw chart
- Store it in public folder
The chart has been improved to follow @aggroed suggestions:
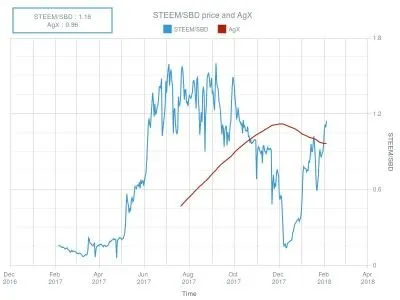
- Factor renamed to AgX
- Tooltip shows today values for AgX and Steem/SBD ratio
Next steps
Next step will probably be the final one and will integrate Steem.js to allow the backend to publish posts containing the AgX information.
Release coming soon!
Posted on Utopian.io - Rewarding Open Source Contributors