In my post yesterday, https://steemit.com/trading/@xaero1/bitcoin-ta-another-triangle-formation-and-could-this-break-soon , I presented a fairly negative sentiment scenario for bitcoin medium term, based on some charts.
Today the price did break below the triangle I had drawn. (And btw, this co-incided with Sunday morning UTC, which, from my experience seems on average to be not the best time for prices.)
However:
(1) The break down only went very slightly below the triangle
(2) It didn't go below the previous recent low point (almost a double bottom even, which is normally positive)
(3) The bounce back was quite powerful - and, in fact going above where it started.
So, all the these factors look a bit more positive, at least in the short term.
Now, often what people do when the price breaks out of a triangle, but not significantly, is to just draw a new triangle :)
This is not really scientific - although you might say the same for all of TA! Anyway, based on the new data, I've drawn a new triangle :) Only time will tell if this is any better than the last one, however. One thing is though that in hindsight, the previous triangle was pretty steep - which didn't give it much time to resolve.
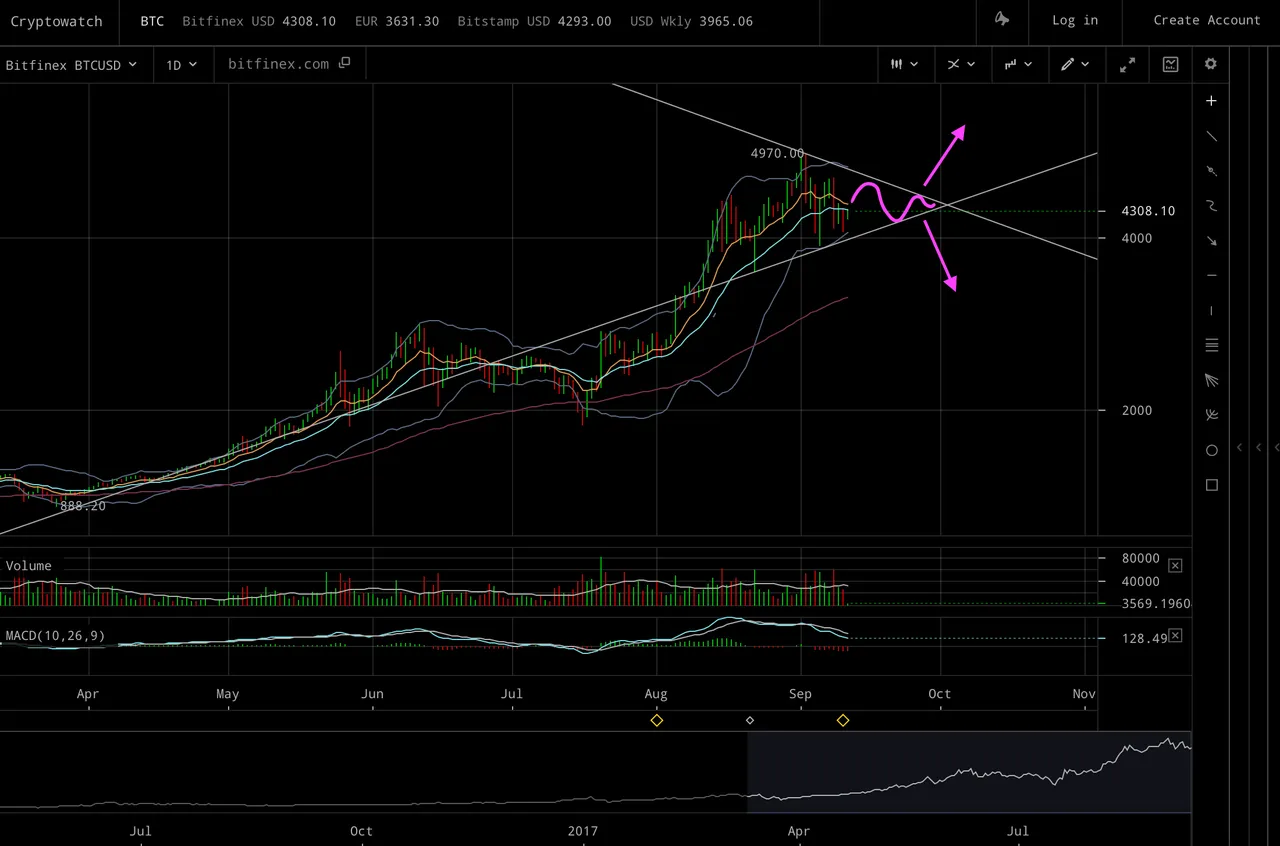
In this case I speculated about what might happen if we got the typical triangle-like pattern. We would then expect the price to break up or down at the end. (Note: This is just speculation, and not any trading advice.)
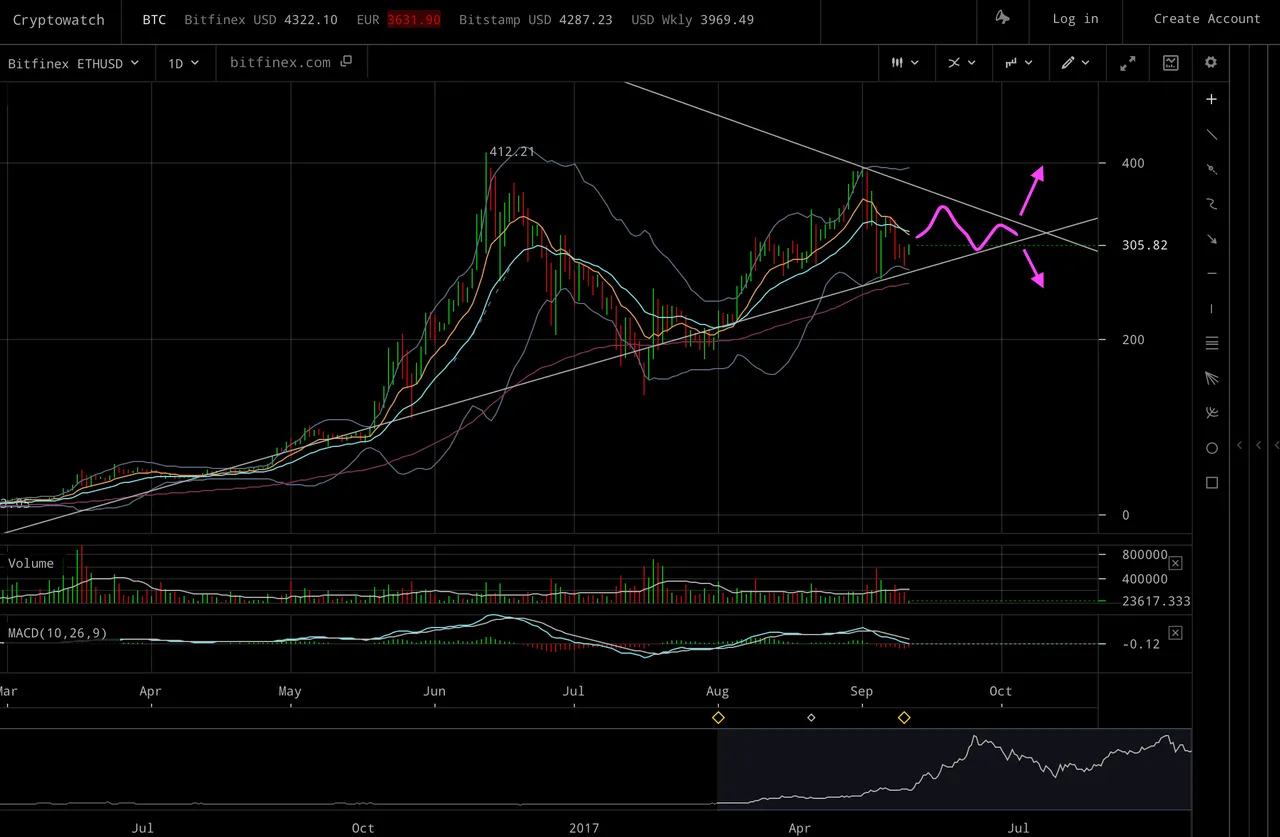
The Ethereum chart (as well as pretty much all of the other cryptos) have recently been very similar to bitcoin. I.e., the whole of the crypto market has been moving very much in sync. Anyway, here's another chart, this time showing what a triangle pattern could look like for ethereum (again, pure speculation, and not trading advice.)
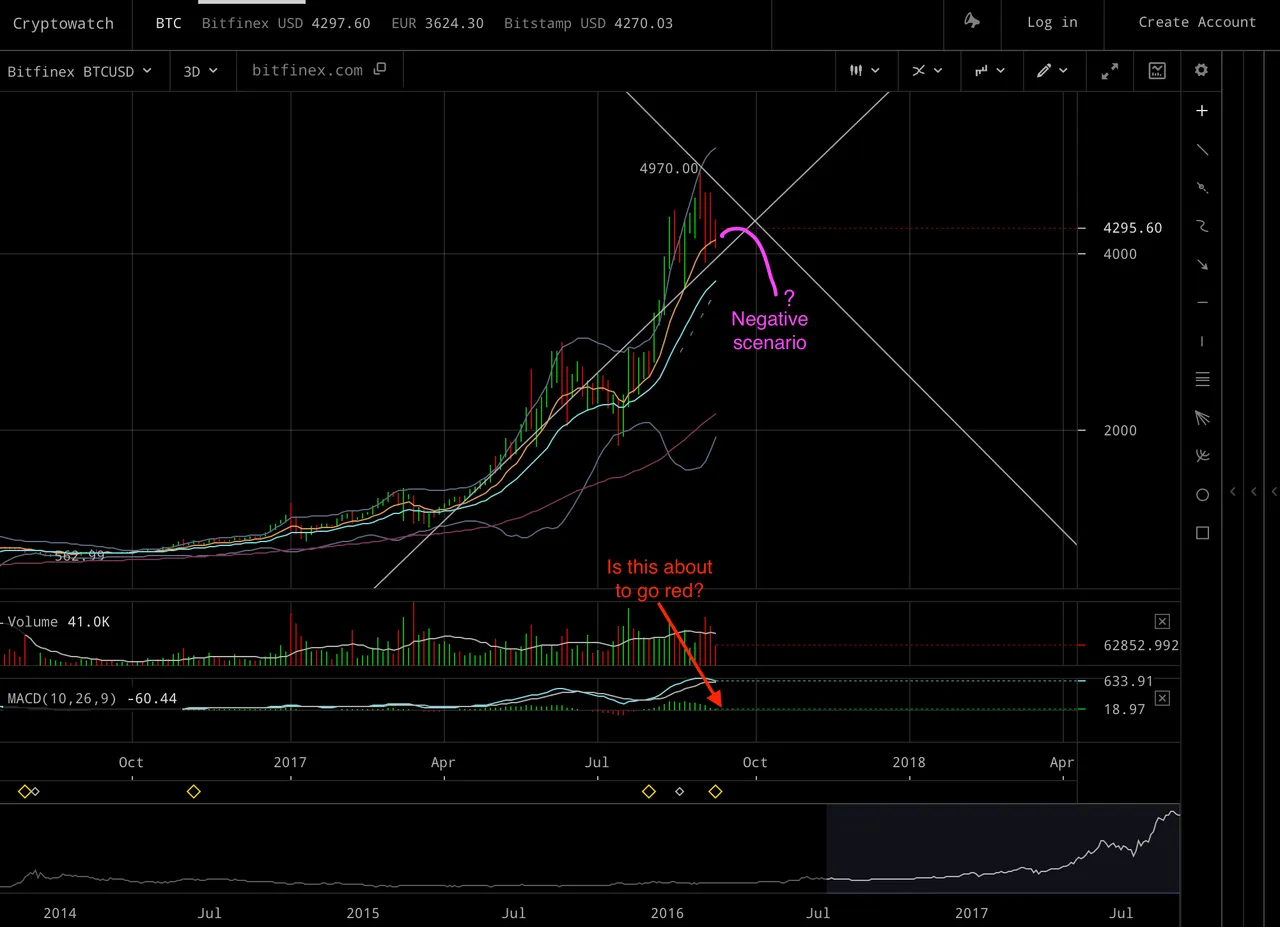
Now, an interesting thing is that if we move to the 3 day charts, the shape of the Ethereum EMA's look to me just a bit more positive than the Bitcoin EMAs. This is purely subjective, and someone else viewing the charts might take the reason view there's nothing discernible to back this up. But, for argument's sake lets just imagine Bitcoin were to break downwards, but Ethereum upwards - then we might get something like the following charts:
and
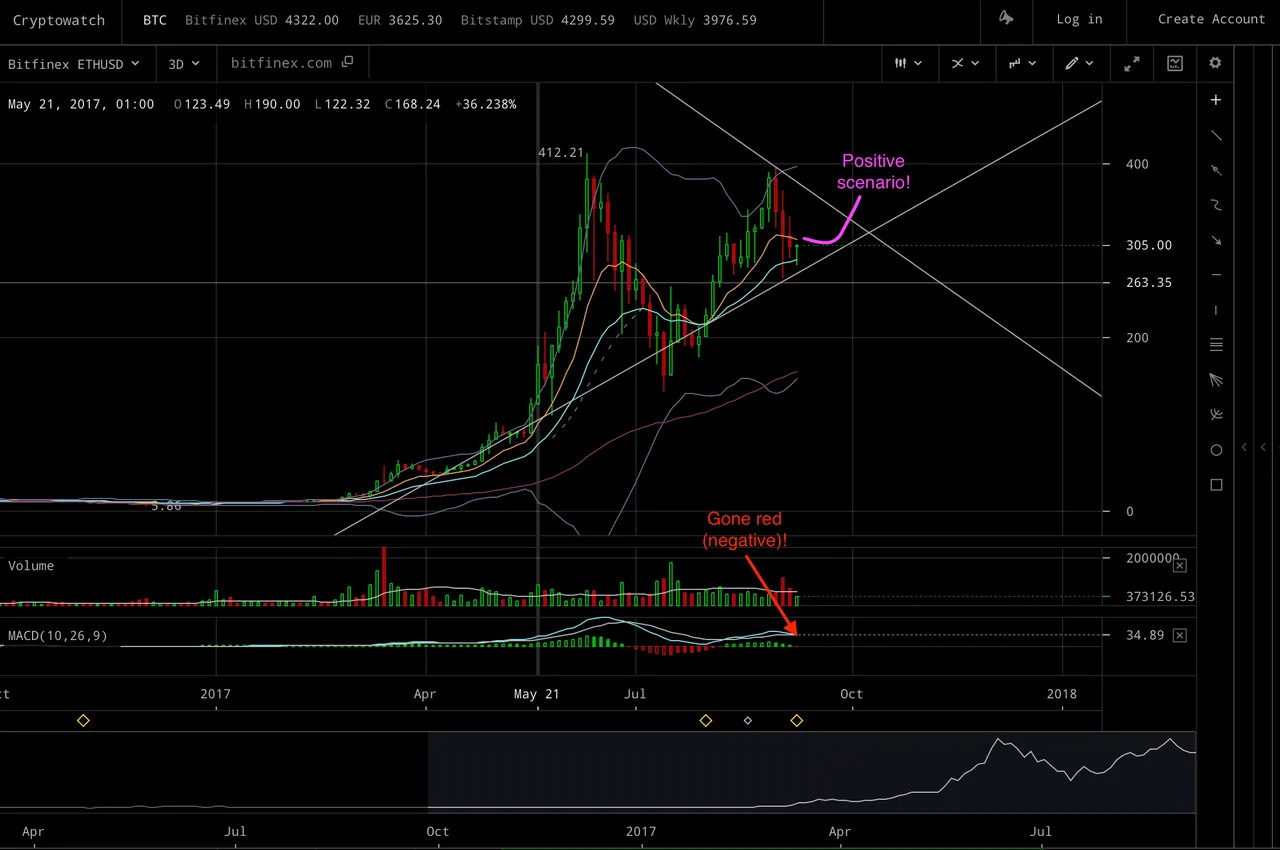
First of all, on the Ethereum chart the MACD has already gone red, so this not a positive factor. On the Bitcoin chart it's still green, although looks like it could go red soon.
I guess the main thing I see which is slightly different in the two charts is the shape of the gold EMA lines.
On the bitcoin chart, we've got a very rounded curve, which is still ascending. But when I imagine where it might go next, I'm drawn (no pun intended ;) ) to a symmetrical downward scenario following it as not an unlikely prospect.
However, on the ethereum chart, we see that the gold EMA has started to descend but it seems to be not descending as rapidly as it ascended on the way up. This is the main very slightly 'positive' thing I'm seeing.
Note that the bitcoin chart EMA hasn't started descending yet, so maybe it will do the same thing - or maybe even it will start ascending again more rapidly (which would mean the price would have been moving upwards again).
But the other reason why I'm semi-expecting that Ethereum might have a bump upwards is due to the fundamentals: part one of the Metropolis hard fork is due to be released within around a month or so's time. As well as adding some functionality, a key thing is that it decreases the supply rate by 60%, from what was occurring around six months ago before the 'ice age' started increasing block times. It's possible that because the issuance levels may be quite similar to the levels that the ice-age has now reached, we shouldn't expect much impact on price. Or it could be that the change has already been priced in with the recent rise.
However, it's still close to a very significant reduction in issuance from the around the last peak when we hit over $400. And many people suggested that the recent 'halvenings' in bitcoin and litecoin would have already been 'priced in' - but the reality was the prices roughly doubled in the weeks before the halvenings!
However, if we look at the Ethereum price relative to Bitcoin, it has slowing been falling over the last few months. So, for Ethereum to go up, but not Bitcoin, there would have to be a big spike in the following graph in the next few weeks:
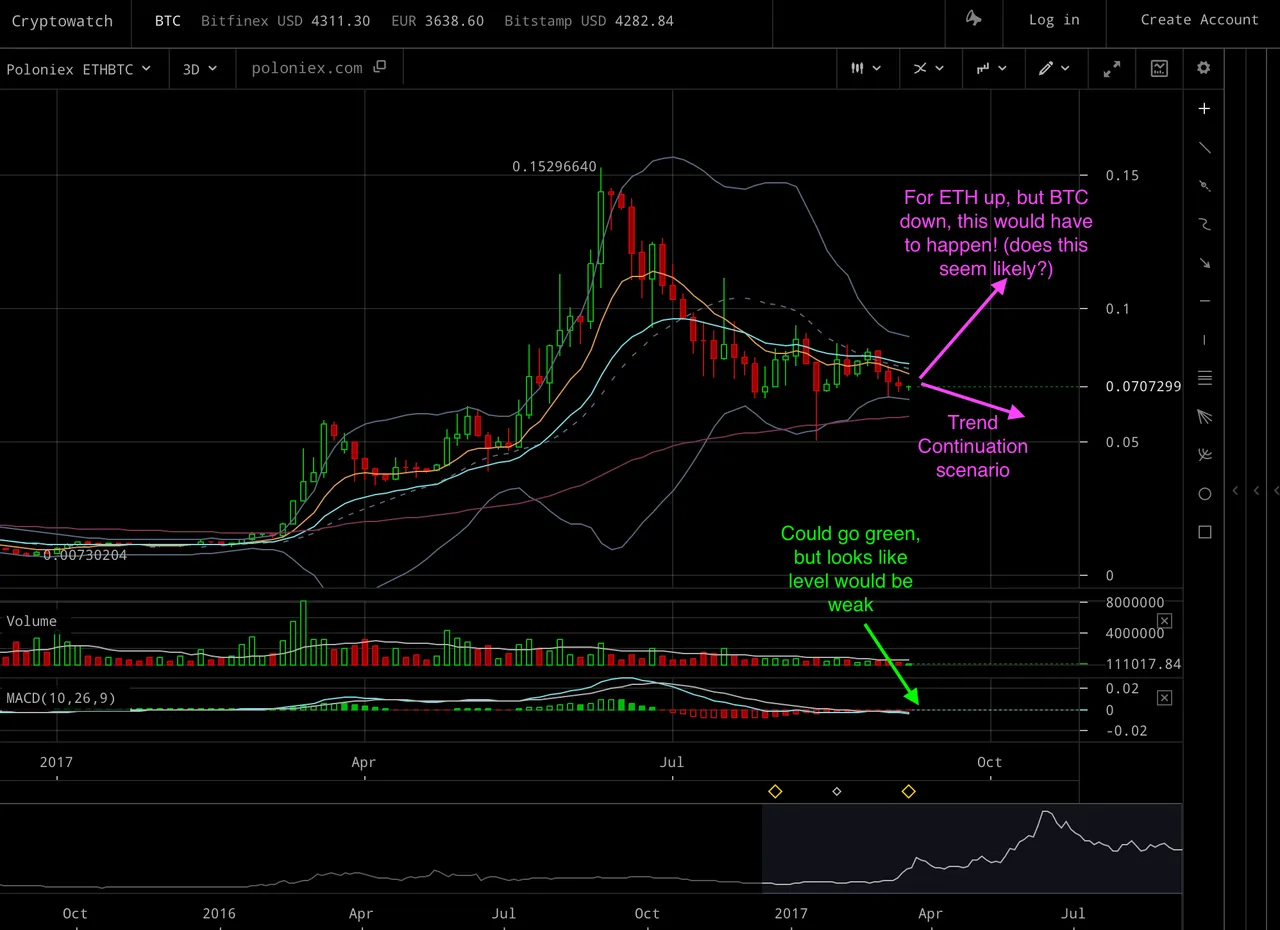
If this doesn't happen - and currently it doesn't look too likely to me from the charts - then clearly this particular outcome where Bitcoins goes down, but Ethereum goes up would not take place.
Update: As I was typing this post up earlier today, I wasn't watching the chart, and bitcoin 'crashed' over $200 and I was in a 'buy' position and so missed selling before this (which cost me! :'-( ) So as I was pretty annoyed, and closed my computer down and didn't post this! Anyway, as I made the charts I thought I might as well post them, and give an update since :)
Right now, as I'm typing it looks like we might just be forming short term local bottoms on the Bitcoin, Ethereum, and other crypto charts.
The charts are very similar, but here's the current Ethereum 6 hour chart
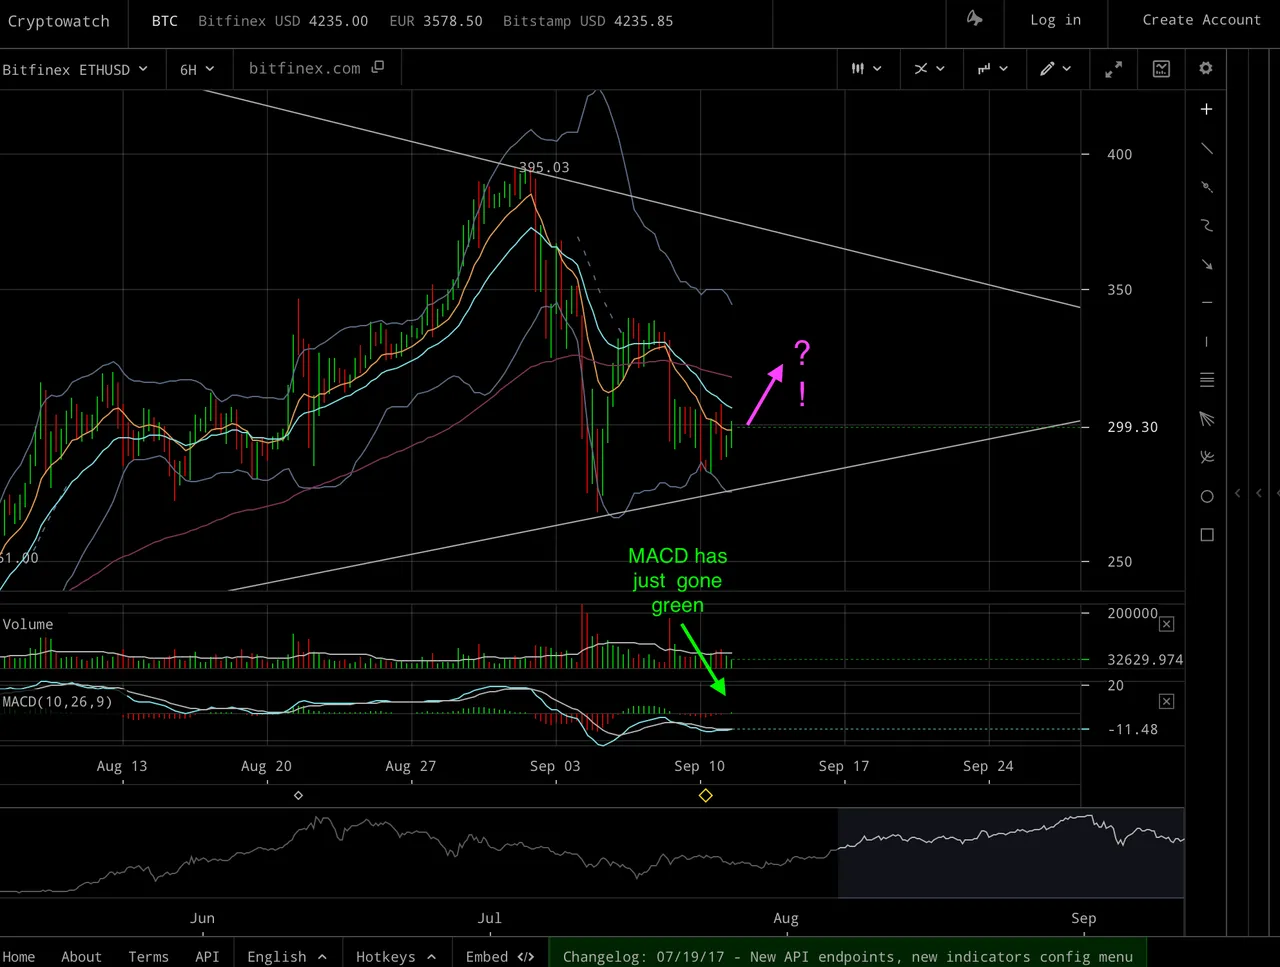
As we can see the MACD has just gone green, which is positive. But will see the price move up?
Here's the Bitcoin 2 hour chart:
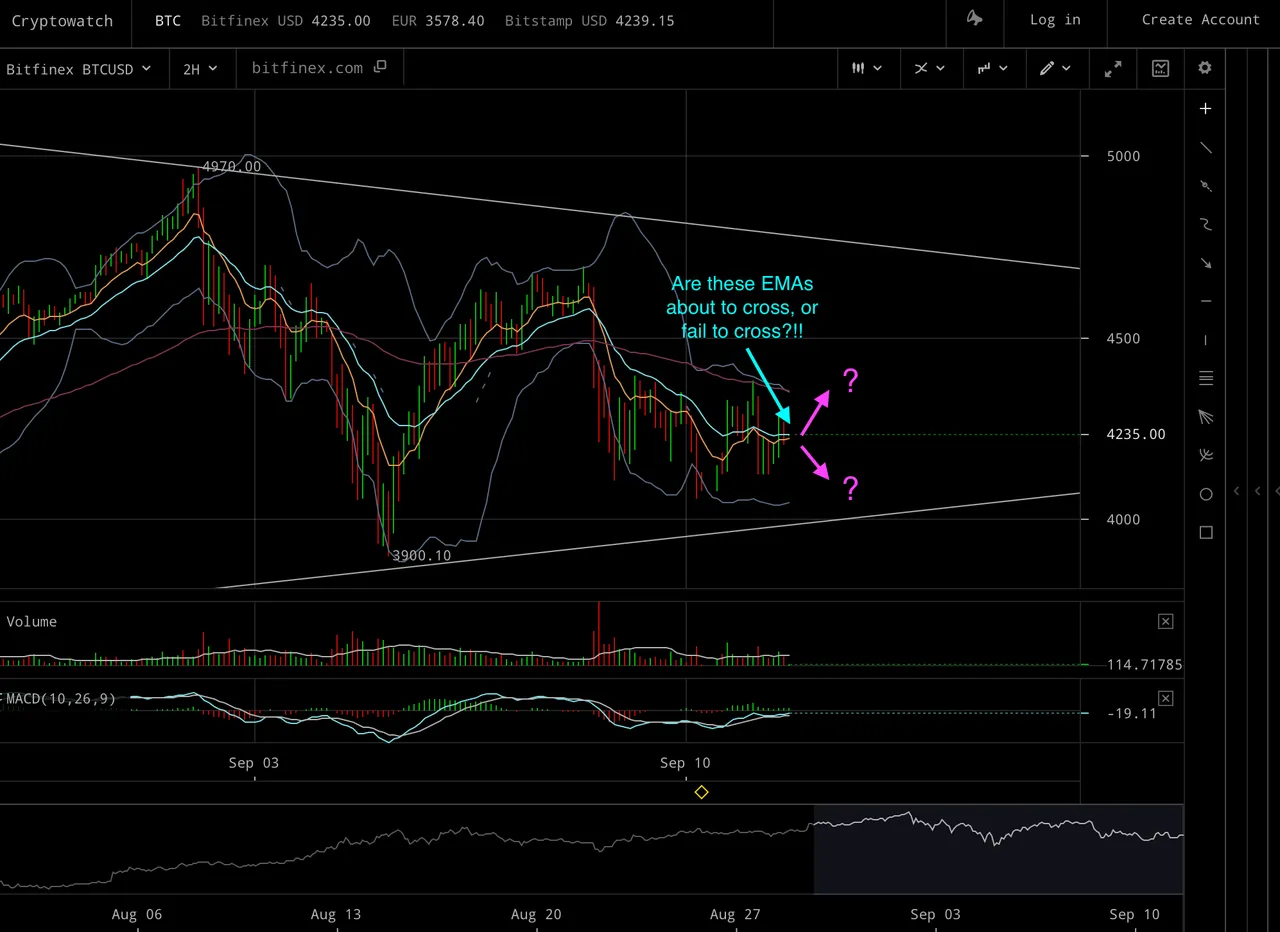
If the EMAs cross over to the positive direction, then I would expect a short-term upwards price movement could occur.
There is one thing I notice about the current bitcoin 'top'. It looks to me like it's slightly asymmetrical in a positive way. Do you see this at all in the following graph, or maybe I'm imagining it? Often at the final end to a dramatic price move we should expect the downward part to look very similar to the upward part, or typically with crypto, a much a steeper decent. And, we haven't had a 50% retrace yet which I find unusual.
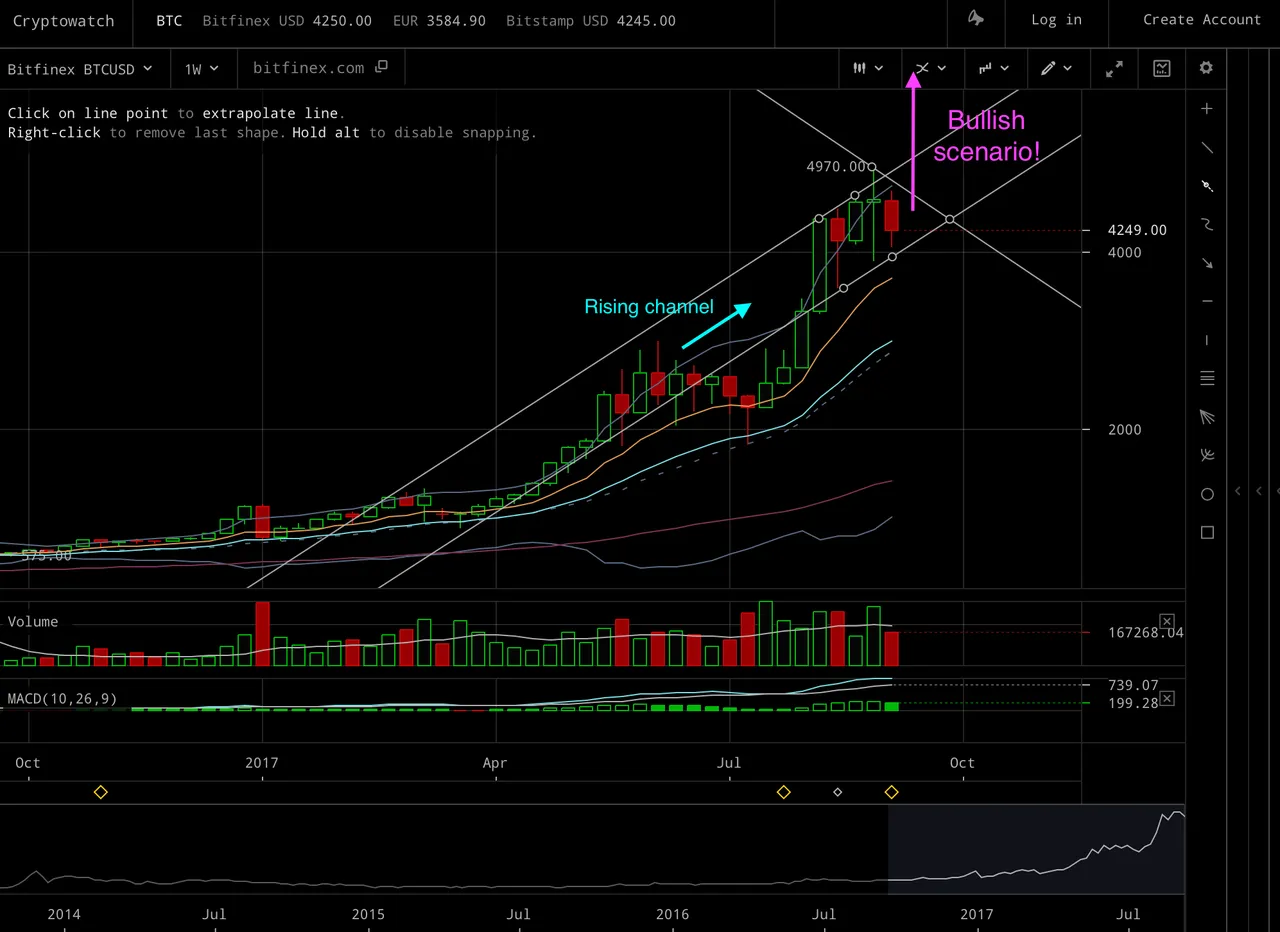
So here's a bullish scenario for bitcoin :)
But, I still think that a 'correction' is what's much more likely to happen next. But either way, I'll be following charts, and trying to reacting accordingly.
Finally, here's an interesting chart from 'coin.dance' which shows the market caps of bitcoin and the other cryptos.
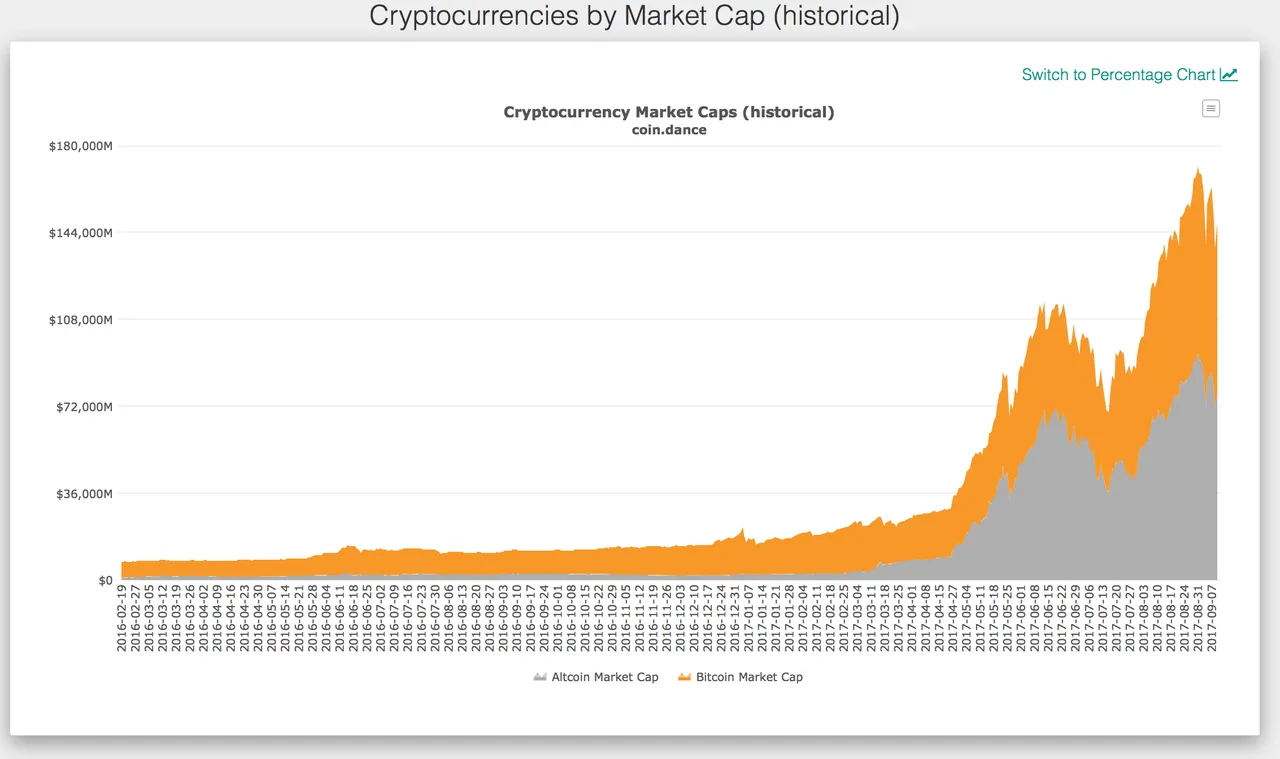
Does this look like we recently formed 'a top' - and if we have indeed formed a top - then, does either a suggest a period of correction is next (or even the end of the whole 'bubble')? Guess we will find out in the not to distant future!
I'd be interested to hear if anyone thought this post was interesting, or if anyone has views on the where they think Bitcoin / Ethereum prices are heading next?
Disclaimer: The post is not offering trading advice. And all of drawings presented here are just speculation about some potential scenarios (out of the infinitely possible scenarios for what might happen!) - and are not necessarily my expectations even, either.