Conclusion for today’s analysis: The minimum expectation for the USDSGD is ~1.33439.
Price action from May 03, 2018 to current date is shown in today's analysis for the USDSGD on a 6 hour timeframe.
A top formation that took almost 6 months to complete i.e. between July 02, 2018 to December 27, 2018 is identified as a complex head and shoulders pattern.
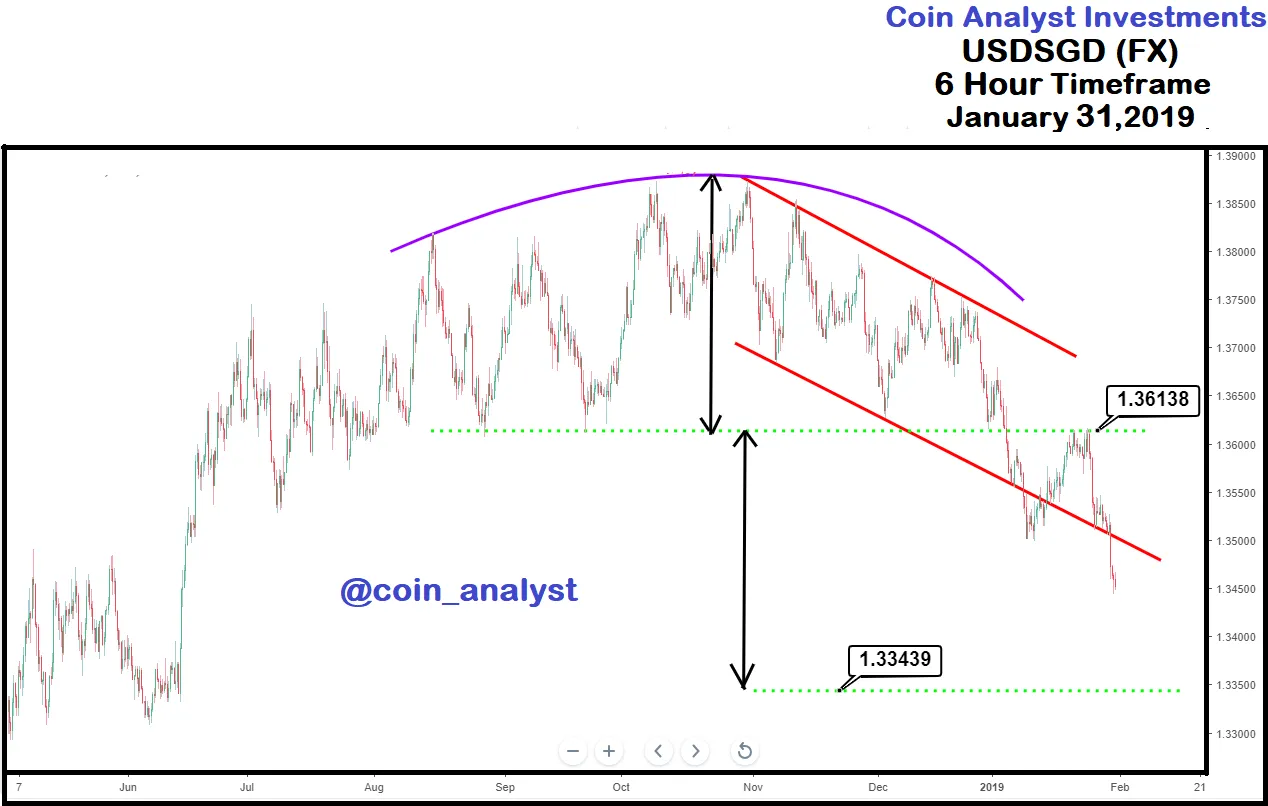
Confirmation of the chart pattern occurred on the January 04, 2019 when price action closed below the neckline of the pattern at ~1.36138.
The bearish implication of the pattern mentioned above is not yet complete and the minimum expectation for price action is 1.33439 achieved via a vertical projection of distance between the head of the pattern and the neckline.
Any current bullish swing or retracement of the current uptrend should be considered for entry point into a bearish position(s).
Interested in the GBP CHF (FX)? Check out our previous analysis below:
https://coinanalyst.investments/2019/01/27/gbp-chf/