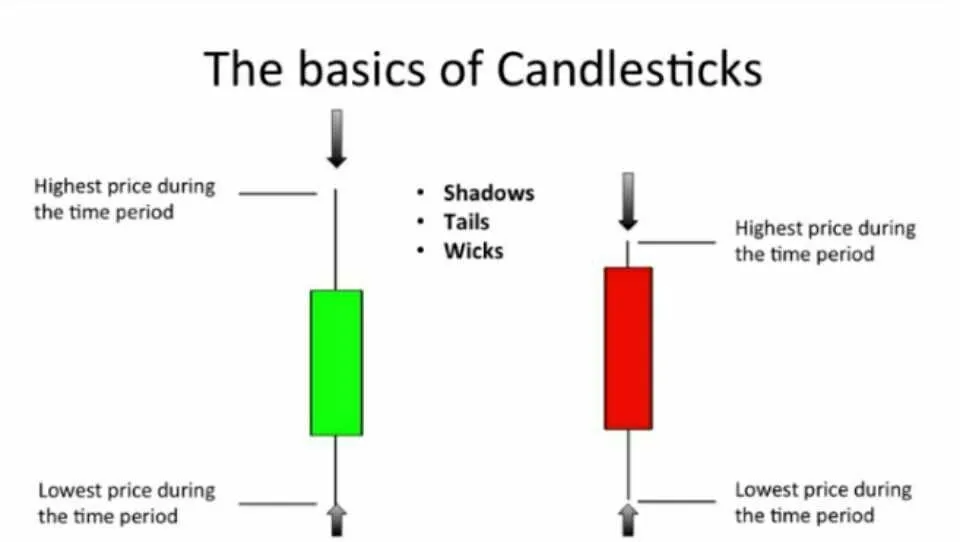
Candlestick is a chart that displays the high, low, opening and closing prices of a security for a specific period. The wide part of the candlestick is called the "real body" and tells investors whether the closing price was higher or lower than the opening price. Black/red indicates that the stock closed lower and white/green indicates that the stock closed higher.
Source
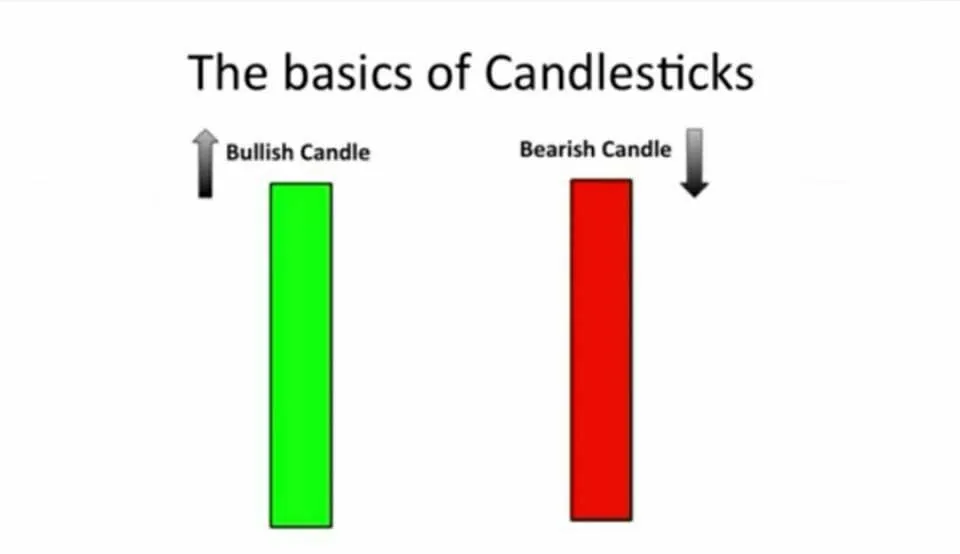
BULLISH & BEARISH CANDLE
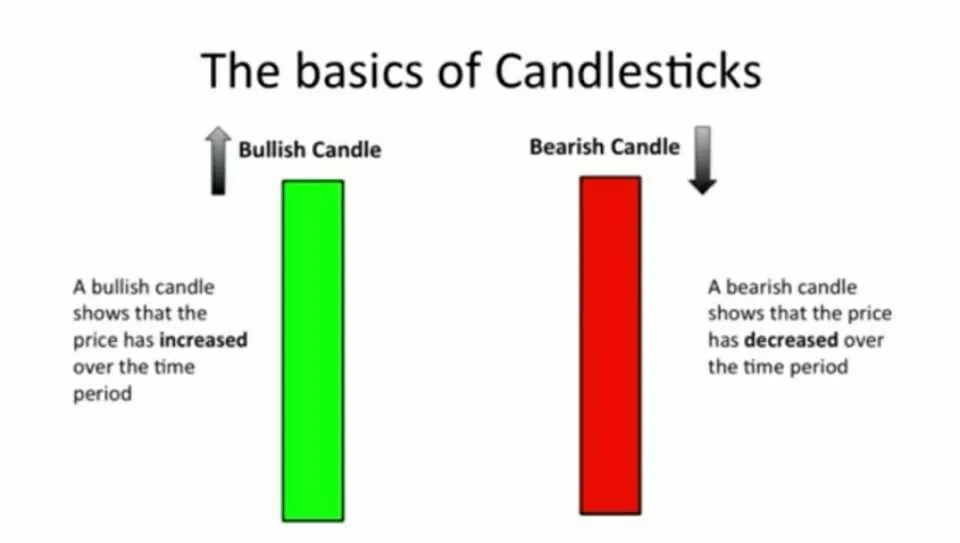
- A bullish candle shows that the price has increased over the time period.
- A bearish candle shows that the price has decreased over the time period.
REAL BODY
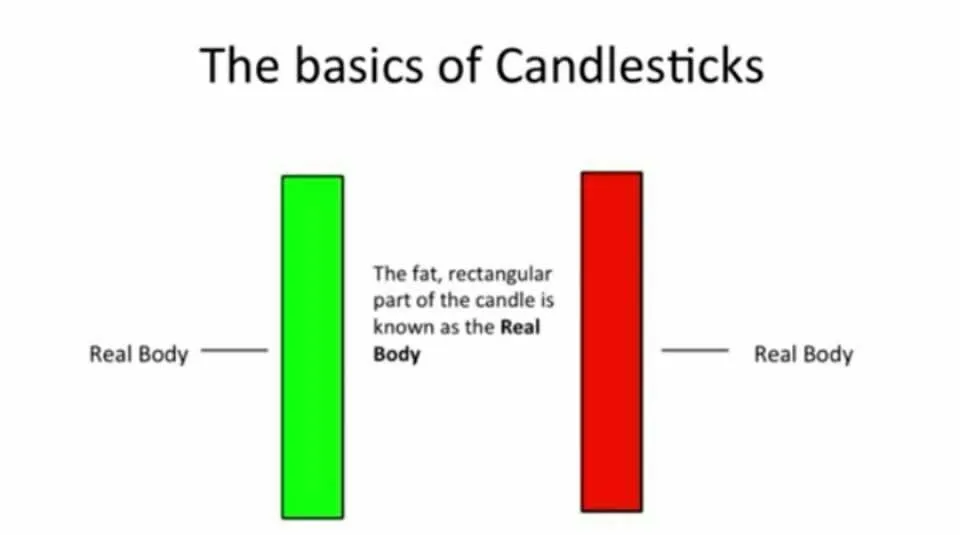
- The fat, rectangular part of the candle is know as the real body.
DOJI CANDLE
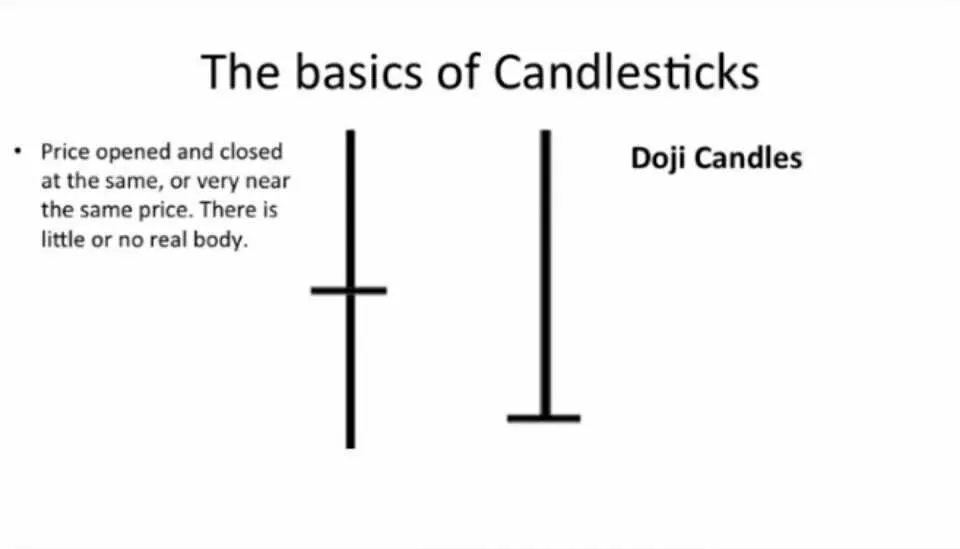
- Price opened and closet at the same, or very near the same price. There is little or no real body.
these are just a few examples to learn about candlestick, hopefully useful.
Thank You