[EN]
Remembrances. Because Bitcoin could not see 20 thousand dollars, analysts, reporters, journalists ate themselves up. The historical record has already been broken. For something to happen, for example, to be the Moon, you have to see a collection of numbers called $20000. Is that a condition? It's funny to me. $19918 what's not enough?
Anyway, okay, after I write this article, BTC will see 20 thousand dollars so that people can breathe a sigh of relief. :)
The question is, what does BTC expect to rise? And the answer is, BTC is waiting to beat the Fomos in people's minds, the fears of decline.
Didn't we follow the prices together until they reached the 19918$ level? Didn't we know about your every move? Open and read past articles. Look what the analysts said, what BTC did. He dealt with a lot of resistance until he got to these levels. He's broken a lot of hard channels, he's trying to break them, and now he's broken the record for years, the record that everyone's been waiting for. What happened then? After seeing 20 thousand dollars for months, we listened to people who said it would fall, and the BTC did not rise or fall. This. If we could stop selling Bitcoin out of fear, the first goal is 23 thousand dollar.
BUY SIGNAL IN BTCUSD HOURLY CHART
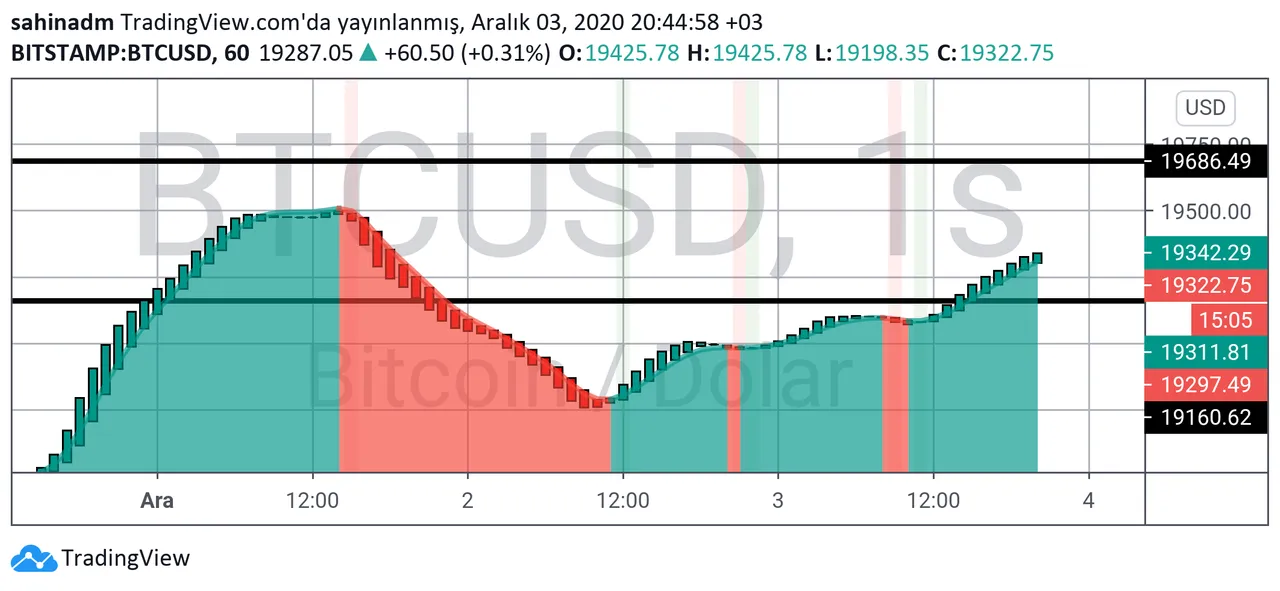
The hourly chart moves forward to make minor corrections, consolidating its place. Imagine a chicken sitting on an egg. It tries to sit tight by moving his ass around so that the egg is well protected and warm. That's how Bitcoin goes. The summary of the three paragraphs I was talking about in the introduction section of the article was this chicken example.
There's an BUY signal on the hourly chart. And the goal is clear, 19918 dollars. Resistances are also obvious, $19160 19986$ and again $19918.
Below are $18881 and $17221 as support. Look, these supports have been crossed upwards, but it's too early to say 'broken'. Especially $17221 is very important at this stage. Everything is ready.
*** BUY SIGNAL IN BTCUSD 4-HOUR CHART***
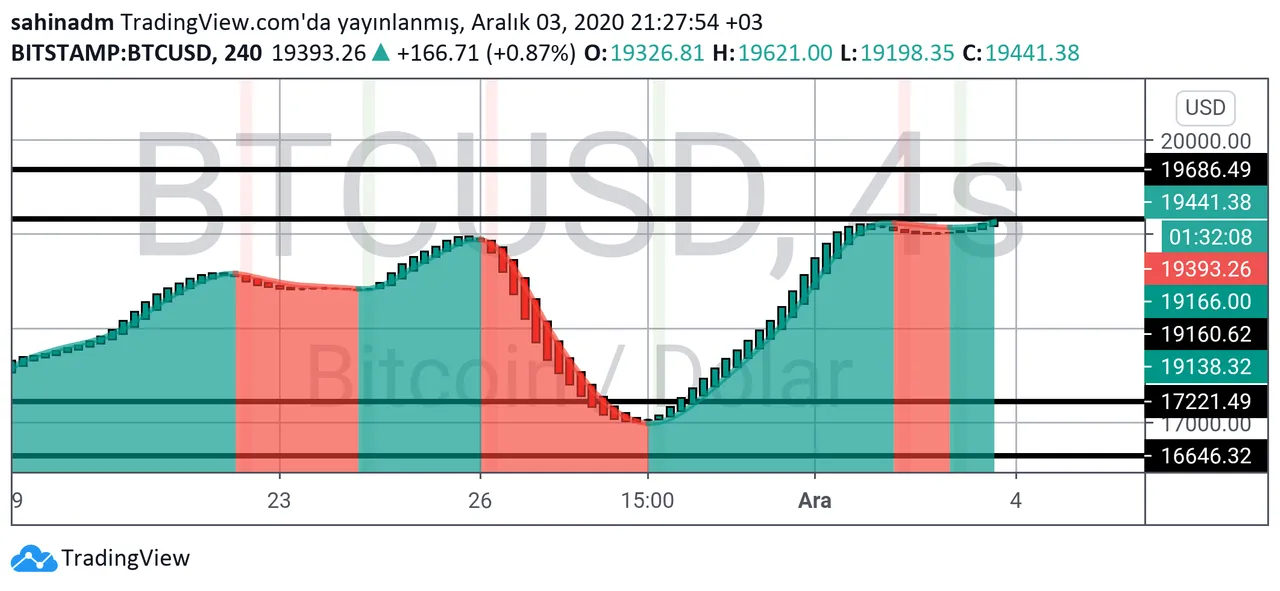
Everything's ready. All that's left is this $19160 resistance. If he added this to the average resistance and could be permanent for at least a week. Oh, he'll say.
A Bitcoin investor is an investor who knows his business. Those who lead the market are the ones who can trade both before Bitcoin and together with Bitcoin. And their numbers are not so few to be underestimated. So Bitcoin will rise, fall as it rises and rise again. And the states will do nothing about it. Because there's a line of strategists here. Ahan also wrote here.
Resistors for the 4-hour chart, $19160, $19686 and $19918. There's higher, but now it's early to write.
Supports are $19009,$ 18100 and $17221. There's more, but there's no need to write right now. I don't want to create an atmosphere of panic.
***BUY SIGNAL IN BTCUSD DAILY CHART ***
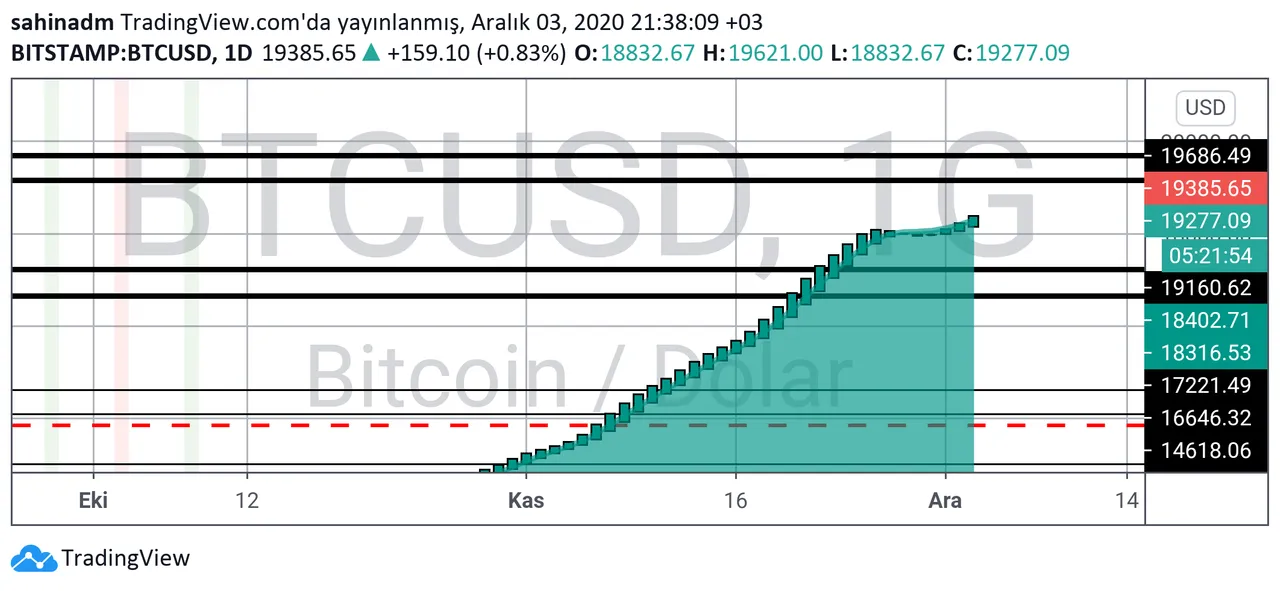
Here's how the prints from the last 4-hour correction in the daily chart read from the candles that last 3 days of instability and that instability. The last 3 days have progressed comfortably. And today is exactly fine.
Resistors are the same as the above, but different and I have been waiting for a long time and this is the first time I have come so close to 21 thousand dollars and 23 thousand dollars resistors. Everything is going well now.
Supports are $19160, $18316, $17221 and $16646 to $15715.
I'm having trouble sleeping right now. Have a nice evening. Conveniences.
[TR]
Selamlar. Bitcoin bir türlü 20 bin Doları göremedi diye analistler, muhabirler, gazeteciler kendini yedi bitirdi. Ulan zaten tarihi rekor kırıldı. Bir şeylerin olması için, mesela THE Moon olması için, illa 20000$ diye bir rakamlar topluluğu mu görmek lazım. Şart bu mu yani! Bana komik geliyor. 19918$ neye yetmiyor abi? :D
Neyse tamam bu yazıyı yazdıktan sonra BTC 20 bin Doları görsün de insanlar bir rahat nefes alsın. :)
Soru şu, BTC yükselmek için neyi bekliyor? Cevap da şu, BTC insanların kafasındaki FOMO'ları, düşüş korkularını, yenmeyi bekliyor.
Fiyatları 19918$ seviyesine gelene kadar beraber takip etmedik mi? Her hareketinden haberimiz olmadı mı? Açın geçmiş yazıları bir okuyun. Analistler neler demiş, BTC neler yapmış bir görün. Bu seviyelere gelene kadar bir sürü dirençle uğraştı. Bir sürü zor kanalı kırdı, kırmaya çalışıyor, ve şimdi yılların rekorunu, o herkesin beklediği rekoru, kırdı geçti. Sonra ne oldu? Aylardır 20 bin Doları gördükten sonra düşecek, diyen insanlara kulak astık ve BTC yükselmedi de düşmedi de. Olan bu. Şu Bitcoin'i korkudan dolayı satmayı bir bırakabilsek ilk hedef 23 bin Dolar.
Neyse ya. Çok uzattım yine. Grafiklere bakalım da gözümüz gönlümüz açılsın. :)
BTCUSD SAATLİK GRAFİKTE AL SİNYALİ
Saatlik grafik ufak düzeltmeler yapa yapa ilerleyerek yerini sağlamlaştırıyor. Yumurtaya oturan tavuğu hayal edin. Poposunu şöyle bir sağa sola hareket ettirerek sağlam oturmaya çalışır, yumurta iyi korunsun ve sıcak dursun diye. İşte Bitcoin de böyle otura otura ilerliyor. Yazının giriş bölümündeki saçmaladığım üç paragrafın özeti bu tavuk örneği oldu.
Saatlik grafikte AL sinyali var. Hedef de belli, 19918$. Dirençler de belli, 19160$ 19986$ ve yine 19918$
Aşağıda destek olarak ise 18881$ ve 17221$ var. Bakın bu destekler yukarı yönlü geçildi ama 'kırıldı' demek için henüz erken. Özellikle 17221$ bu aşamada çok önemli. Her şey hazır. Ya herro ya merro!
BTCUSD 4 SAATLİK GRAFİKTE AL SİNYALİ
Her şey hazır işte. Geriye sadece ve sadece şu 19160$ direnci kaldı. Bunu da ortalama dirençlerin arasına bir katıverse ve en az bir hafta buranın üzerinde kalıcı olabilse. Oh be, diyecek.
Bitcoin yatırımcısı işini bilen yatırımcıdır. Piyasaya yön verenler ise hem Bitcoin öncesinde hem de Bitcoin ile beraber trade işinde cirit atabilen kişilerdir. Öyle hafife alınacak kadar da az değildir sayıları. Bu yüzden Bitcoin yükselecek, yükseldikçe düşecek ve tekrar yükselecek. Devletler ise buna hiçbir şey yapamayacak. Çünkü stratejist bir yatırımcı silsilesi var burada. Ahan da yazdım buraya.
4 saatlik grafik için dirençler, 19160$ 19686$ ve 19918$. Daha yukarısı da var ama şu an erken yazmak için.
Destekler ise 19009$, 18100$ ve 17221$. Daha aşağısı da var ama şu an gerek yok yazmaya. Panik havası yaratmak istemem.
***BTCUSD GÜNLÜK GRAFİKTE AL SİNYALİ ***
Günlük grafikte son 4 saatlik düzeltmeden gelen baskıların izleri 3 gün süren kararsızlık ve o kararsızlığın göstergesi olan mumlardan işte böyle okunuyor. Geçtiğimiz son 3 gün ise rahat ilerledi. Hele bu gün tam olarak iyi.
Umarım ki 'küçük enişte' gibi davranmaz. Yoksa onu kimse tutamaz. Sıkıntı olur.
Dirençler yukarıda saydıklarımla aynı olmakla birlikte farklı olan ve uzun bir süredir beklediğim ve ilk defa bu kadar yaklaştığım 21 bin Dolar ile 23 bin Dolar dirençleri. İyi gidiyor şu an.
Destekler ise 19160$, 18316$, 17221$ ve 16646$ ile 15715$ seviyeleridir.
Uyku İle başım dertte bu aralar.İyi akşamlar. Kolaylıklar.
Dilerseniz yazıyı buradan ve buradan da görüntüleyebilirsiniz. Kolay gelsin.

Analizlerim hiçbir şekilde yatırım tavsiyesi değildir, genel durumu belirlemek içindir. Bu analizler al/sat yapmaya uygun değildir. Bu analizlere dayanarak yapılan alım veya satımlardan doğacak zararlardan yatırımcı sorumludur.
Grafikler, www.tradingview.com grafik veri sunucusunda @sahinadm tarafından oluşturulmuştur.