Hello Steemians,
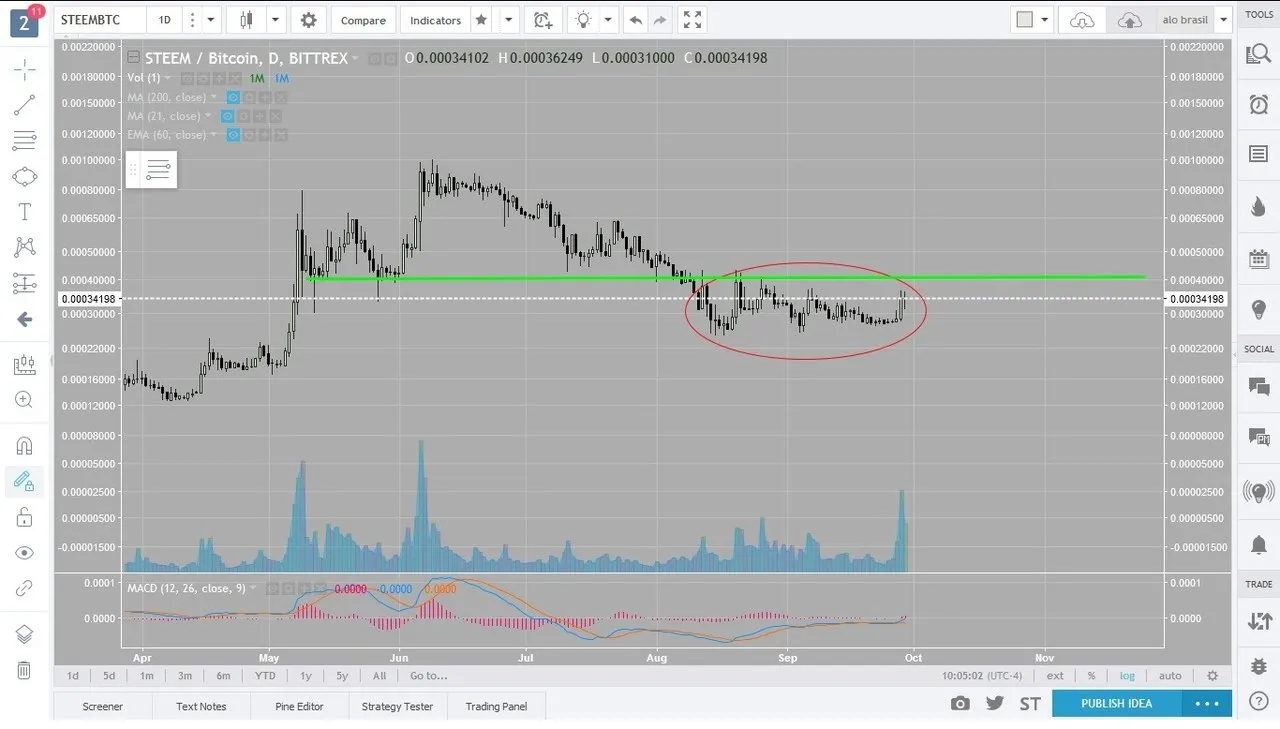
On the STEEM/BTC daily chart we can see the price breaking a down trend line with a 18% elefant bar,
and also a triangle formation :

The Fibonacci levels shows the price 0.00041 is the next support line, and/or target:

The volume of transactions is getting bigger, and the price maybe will follow an uptrend if the price breaks this consolidation area :
I bet the price will go up !
Take your own risks, maybe i´m 100% wrong ! I´m not a financial adviser !
What do you think?
Hope you enjoy !
Follow me and Resteem ;)