Steem and its distribution of equality
In this post we examine the state of Steem Power distribution in the Steem ecosystem. We use the Gini Coefficient in this post as the choice metric. Gini Coefficient is commonly measured to measure nation state income equality, but now we use it on a blockchain. If this is interesting to you, every month we will be taking a snapshot of the Steem blockchain and bringing an update. A few questions naturally arise such as: is Steem closer to authoritarianism or pure democracy?; is Steem becoming more or less distributed over time?
We shall see.
If you are interested in accessing the data used in this article please reach out to contact@quantalys.us, Tweet at @CryptoQuantalys, or chat in the Telegram channel.
Alright let's dig in.

The Gini Coefficient
Imagine a society where wealth was shared equally among all of its citizens. If there were 100 citizens and the wealth was measured as $100. Each participant would own $1. We all know that modern societies display different levels of equality, but how can we measure this? There is a metric that measure the equality of a society called the Gini Coefficient.
The Gini Coefficient ranges between 0 and 1. Some publications show it as 0 to 100. When the Gini Coefficient is equal to zero then society is said to be perfectly even. When the Gini Coefficient is equal to one then society is maximally unequal.
We cannot discuss the Gini Coefficient without discussing the Line of Equality and the Lorenz Curve. Here's a look at the two.
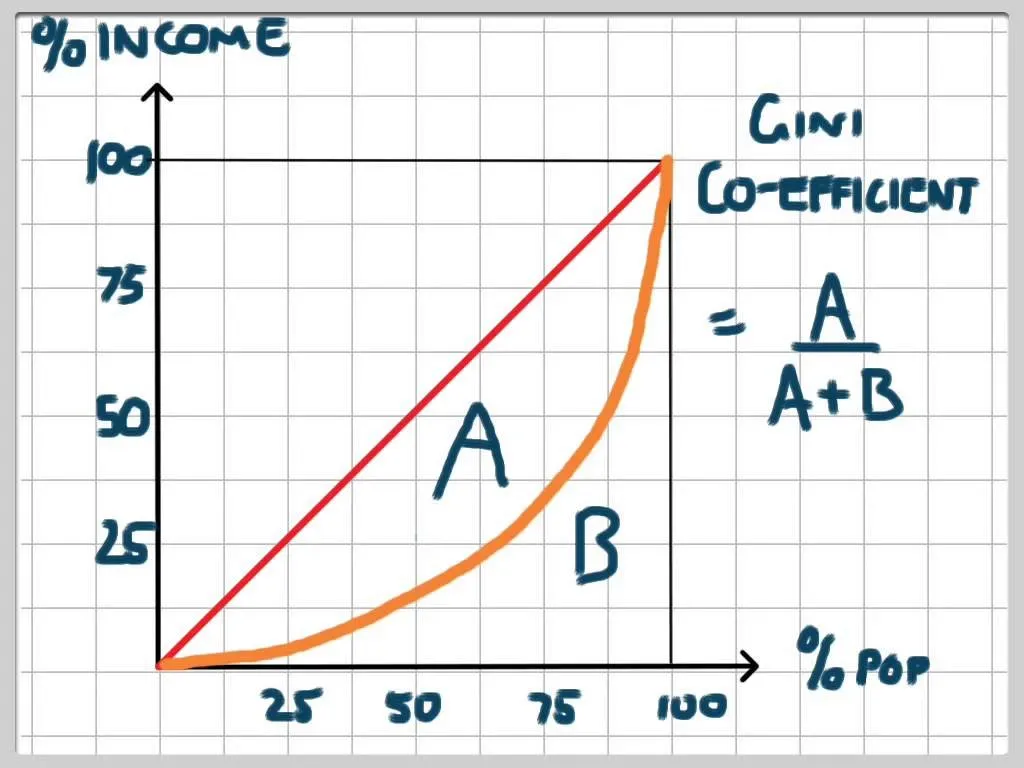
The red line in the chart above is the Line of Equality. In the example of the Equal 100 Citizens above you would chart the red line. The X-axis is the cumulative percentage of the population and the Y-axis is the cumulative percentage of wealth. This post will deal specifically with the distribution of the Steem blockchain.
The orange line represents the Lorenz Curve. This is the actual cumulative percentages of the population and wealth. With these two lines we can calculate the Gini Coefficient. The area between the Line of Equality (red) and Lorenz Curve (orange) is labeled "A". The area below the Lorenz Curve is labeled "B". With these two areas, we can now calculate the Gini Coefficient. The formula is:
Social Implications
Countries with a high Gini Coefficient (approaching 1) are more likely to suffer instability. These nations face unrest with a large swath of the population living in poverty on the verge of acting upon their frustrations. Revolutions occur in this way.
If we go back into history here are a few estimates of different historical eras:
- The Roman Empire's: between 0.42 to 0.44.
- 1688 England Glorious Revolution (overthrow of King James II): 0.47
- Eve of French Revolution: 0.59
- USA in 2015: 0.39
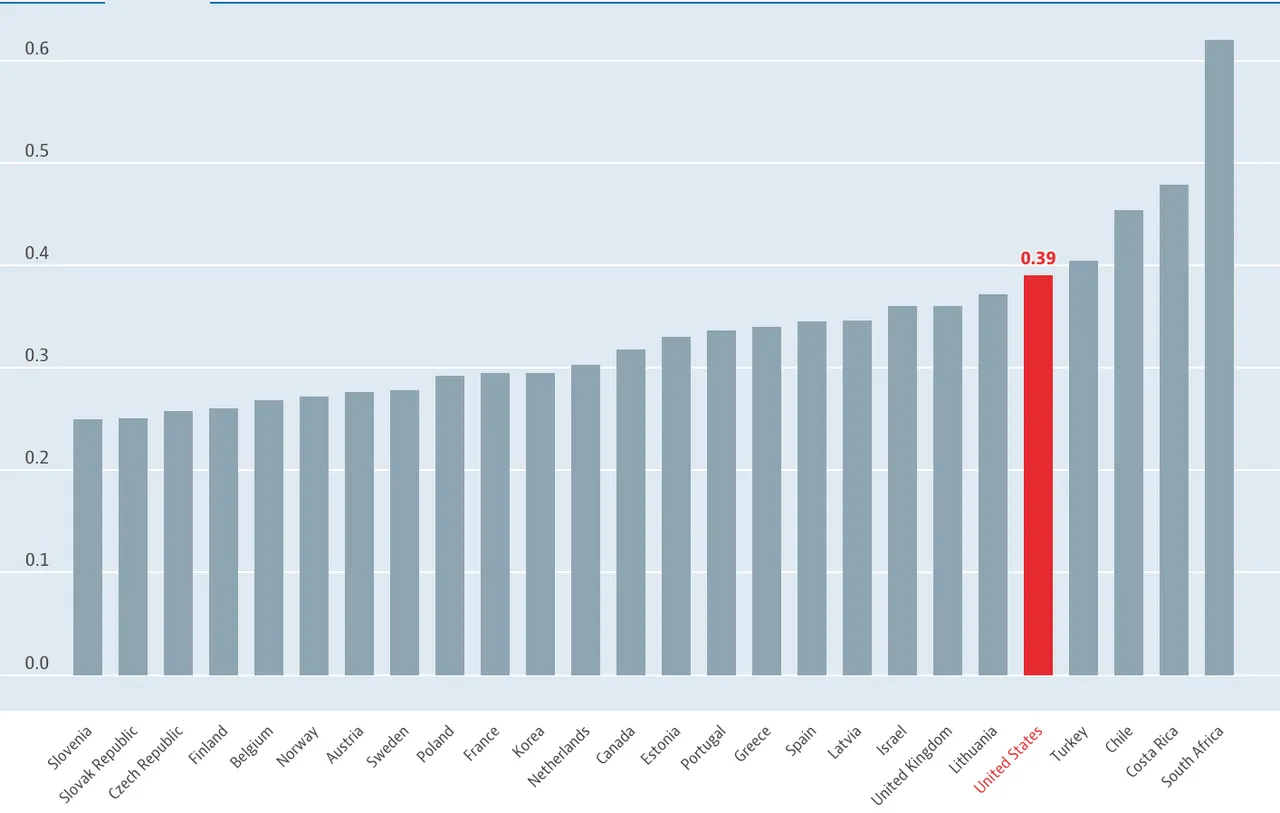
Source: https://data.oecd.org/inequality/income-inequality.htm
Casual Observations
Before diving into the Gini Coefficient of Steem let's take a look at the data. the figures below are based on Net Steem Power, not liquid Steem. Net Steem Power is Non-Delegated Steem Power subtracting out Delegated Steem Power and adding in Received Delegated Steem Power.
Steem Power represents a "locked-in" investment into the platform since users have an elongated withdrawal window. Users with a balance of 0.0 Steem Power were also included unless otherwise stated.Net Steem Power
=
Non-Delegated Steem Power
- Delegated Steem Power
+ Received Delegated Power
Snapshot Taken: May 1st, 2018
Sample size: 961,875 accounts on Steemit sampled
Economic Steem Power: 188.273 Million Steem Power
Top 20 Steem Power Owners: Combined holdings of Top 20 Steemians represent 45.2% of Steem Power (85.07M Steem Power).
The 1%: To be in the 1% of the Steem community you need at least 500 Steem Power.
Quick Stats:
- Steem Power Millionaires (owning 1M+ Steem): 24
- Average / Mean:
- 195 SP per account
- 199 SP per account (excluding 0 balance accounts)
- 153 SP per account (excluding 0 balance accounts and Steemit account)
- Median:
- 15 SP per account
- 15 SP per account (excluding 0 balance accounts)
- 15 SP per account (excluding 0 balance accounts and Steemit account)
A Snapshot of the Top 20
| Account | MSteemPower | % | Type |
| steemit | 44.22 | 23.5% | Team |
| misterdelegation | 5.40 | 2.9% | Unknown |
| utopian-io | 3.63 | 1.9% | Bot |
| postpromoter | 2.84 | 1.5% | Bot |
| minnowbooster | 2.32 | 1.2% | Bot |
| mottler | 2.27 | 1.2% | Unknown |
| blocktrades | 2.14 | 1.1% | Exchange |
| smartsteem | 2.13 | 1.1% | Bot |
| dtube | 2.08 | 1.1% | App |
| dlive | 2.07 | 1.1% | App |
| ned | 1.89 | 1.0% | Team |
| buildawhale | 1.84 | 1.0% | Bot |
| databass | 1.72 | 0.9% | Unknown |
| appreciator | 1.70 | 0.9% | Bot |
| steemcleaners | 1.56 | 0.8% | Plagiarism Fighter |
| michael-b | 1.51 | 0.8% | Unknown |
| val-b | 1.50 | 0.8% | Unknown |
| upme | 1.50 | 0.8% | Bot |
| rocky1 | 1.48 | 0.8% | Bot |
| hendrikdegrote | 1.28 | 0.7% | Individual |
| Top 20 | 85.07 | 45.2% |
Distribution of Steem Power
| SP Group | Users | % of Users |
| 0 SP | 19,854 | 2.10% |
| 1 SP | 30,382 | 3.20% |
| 1 - 10 SP | 64,317 | 6.70% |
| 10 - 100 SP | 825,658 | 85.80% |
| 100-500 SP | 12,200 | 1.30% |
| 500-1K SP | 3,458 | 0.40% |
| 1K-10K SP | 4,870 | 0.50% |
| 10K-100K SP | 973 | 0.10% |
| 100K - 1M SP | 139 | 0.00% |
| 1M+ SP | 24 | 0.00% |
| Users | 961,875 | 100.00% |
Gini Coefficient of Steem
If we include all accounts the Gini Coefficient is 0.93. Now that's high unequality! Remember, this includes the Steemit account which owns 23.5% and Witnesses who have received Delegated Steem Power.
Removing the @steemit account the Gini Coeficient is 0.914. Still highly unequal.
Removing the Witnesses and @steemit we get to 0.911.
If we remove Ned Scott (@ned), Witnesses and @steemit we get 0.910.
If we remove the Bots on steembottracker, @ned, Witnesses, and @steemit we get to 0.893.
If we remove Apps (Dtube, Dlive, Busy.org, DSound), bots, @ned, Witnesses, and @steemit we don't move the need at all. Still 0.888.
If we remove mined accounts, Dtube, Dlive, bots, @ned, Witnesses, and @steemit we arrive at 0.870.
This is more unequal than North Korea.
If we remove all accounts with 10,000 SP and more we get to 0.616.
So how do we get below 0.50. To get there based on the sample data set used, we have to eliminate all accounts with over 3,037 Steem Power. That's not just removing bots, Witnesses, and popular fee charging Steem interfaces such as DLive and Dtube, it's also removing modest sized accounts.
In future posts I hope to incorporate feedback from the Steem community. Another approach of looking at the data would be to eliminate accounts with zero posts as presumably they are just plain old inactive accounts. I'll also hunt down more bots and apps as well to get a clearer picture of the data. Maybe there's something there to swing the numbers.
So where do we go from here?
With all that said, I still love Steemit. It's given me a platform to bring content to the masses for free while receiving rewards. However, the data above clearly shows the current distribution of Steem is far from perfect. Countries with high Gini Coefficients undergo revolutions. If Steem were a country, it too might face the barbarians at the gate. I welcome your suggestions on how to improve the distribution of content.
Thank you for coming to the site. Quantalysus publishes blockchain research and analysis for the crypto community. Please follow on Twitter, Steem (please follow and upvote if you can – thanks!), Telegram channel (New!), and Medium to stay up to date.
If you want to earn Aelf (ELF) tokens for just using Twitter and Reddit, sign up for their candy / bounty program.
If you learned something:
- Please consider donating. My blog’s ethereum address: 0x1ea7ab9acd4294d32bb0c790dd08a66640342680
- Earn Aelf tokens by following them on Twitter (my referral link)
- Follow me on Steem (@quantalysus). I appreciate upvotes!
- Follow me on Twitter (@CryptoQuantalys)
- Education Series: Airdrops
- Education Series: Byzantine General’s Problem
- Education Series: Regulation A and D
- ICO Review: Phantasma
- ICO Review: Holochain
- ICO Review: Edenchain
- ICO Review: Quarkchain
- ICO Review: DAOStack
- ICO Review: Alchemint
- ICO Review: Loki Network
- Coin Review: Ontology
- Coin Review: Aelf
- Coin Review: Mithril: a social network app on the blockchain
- Coin Review: Qtum
- Coin Review: Waves
- Coin Review: Banyan Network (BBN)
- Opinion: Token economics
- Opinion: ICO paradox
- Opinion: Why we love Steem