
While many people simply use Steemit.com to use Steem, this isn't the full story. You might not know it, but every single time you interact with the Steem blockchain, you need to go through an API node -- this is how your application retrieves and submits data.
While Steemit provides their own public API servers, in an effort of reducing this reliance on a single point of failure, my own publicly provided service at https://anyx.io is a high-performance alternative to Steemit servers. Over the past few months it has proven itself a worthy substitute, and is the default choice for many applications such as Busy, Partiko, Steemworld, and more.
Over the past month, the API has been set to collect some aggregated statistics over how it is being used. A large part of the goal is to drive research into what API calls are being made and how often, to help further optimizations to the API. However, I found the whole data itself to be pretty interesting and worth a share.
A Note on Privacy
When people hear "data collection", it is often equated with bad practices, mishandling, and so on. And since the charts below are providing some aggregated statistics, it does mean some data collection.
To hopefully ease your mind if you're concerned about privacy, the data collected is only aggregated stats, e.g. sums. The data that generates what you will see below is aggregated over a month, yet logs are purged every day; this means the data couldn't even be regenerated if one wanted to. In addition, the only data used is what is provided by the requestor (and could even be spoofed), and thus must be taken with a grain of salt. No data of anything personally identifiable is kept (nor is there any, honestly -- the apps themselves are more likely to see personally identifiable data). An API only sees at a high level what requests are being made to it, and if the app provides it, which app made the request on someones behalf.
Hint: click a chart to view the interactable version! Steemit doesn't support embedding the interactable one, but they are cool to look at.
Average Daily Usage
The first interesting metric to present is "how well used is the API". For that, let's investigate the number of requests made in a given day, as well as the bandwidth (total data transferred), and how many unique visitors made requests.
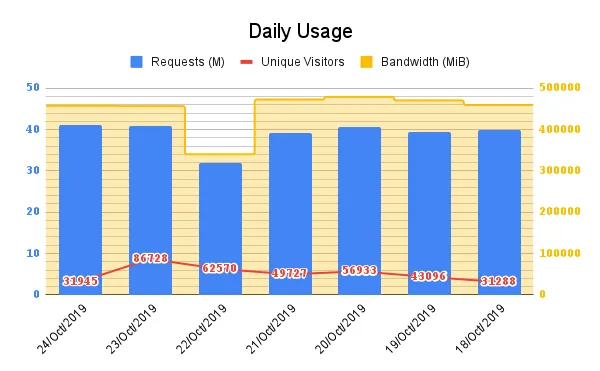
Investigating these metrics of daily usage over a snapshot week shows a fairly even distribution of unique visitors, bandwidth, and API requests over time. The average requests per day is approximately 39 million (that is about 450 requests per second), with an average daily usage of 470 GB of bandwidth, and on average 52,000 new unique visitors per day.
While not plotted, another interesting metric is that during the past month of observing API usage, the API serviced over one million unique visitors (1,195,422 to be precise)!
Usage by Region
As requests come from an IP address, this can be approximately geo-located into which country (likely) is responsible for that IP. With this, one can estimate where traffic is coming from at a high level. This data is not always accurate and is easily circumvented with tools like VPNs, but it is an interesting metric to see regardless.
| Bandwidth (MiB) | Unique Visitors |
|---|---|
 |  |
Looking at our usage by region, there is a really interesting difference between Asia and North America. While America leads in traffic and bandwidth, Asia leads in unique visitors. While some may jump to conclusions why this might be the case (bots), as we will show in usage by app, one of the leaders in usage is steemcn -- with this website alone hitting 150k unique users in the past month. Indeed, as Steemit and their servers are firewalled in China, Steemit.com will not work for the Chinese, but decentralization uh, finds a way, and it seems a large portal to the Steem blockchain from China is through this API.
A possible explanation as to why the US is traffic and bandwidth heavy is that there are many services that run off AWS. I've noticed that there are high volume traffic coming from servers with requests like fetching every block, and users renting for the US market will likely provision their servers in the US. As this API is provided from Canada, US traffic achieves very low latency and supports those services quite well.
Usage by App
During an API request, especially if it is a web application (which most are), the application will make API requests "on your behalf". This is for example how a site like Busy or Steemworld gets its data to present to you -- when you load the webpage, your web browser makes relevant API requests to fetch the right data. During this process, the app can optionally add a little note letting the API know which app made the request. This is known as the referrer. In the following chart, there are some interesting metrics for those apps which are providing referrer data.

Not all apps provide the referrer data, so this chart is actually far from complete. For example, the highest on this chart at about 5 million requests per day is Steemworld, however they only represent about 13% of total request traffic. Many apps, including big ones like Partiko which use the API, may opt to not share the referrer source for various reasons (the most likely simply not bothering to set it). In addition, as this data is self-provided, take the results with a grain of salt (as it may not be accurate).
While viewing the chart, note that the Y-Axis is a log scale. This is because the app breakdown has quite a power-law distribution! Steemworld is over 10x the requests per day of Busy (as their scripts are quite heavy fetching various account data), and Busy is about 3x the next on the chart, Steemhunt, and so on.
API Request Breakdown
Finally, the raison d'être of this post. This is the most interesting metric (for me at least, as the one serving the requests) as it really shows exactly how the API is being used. This breakdown -- a sample of a single day's worth of activity -- shows what API data is being requested, and is thus an important indicator of which API calls should be optimized for future performance.
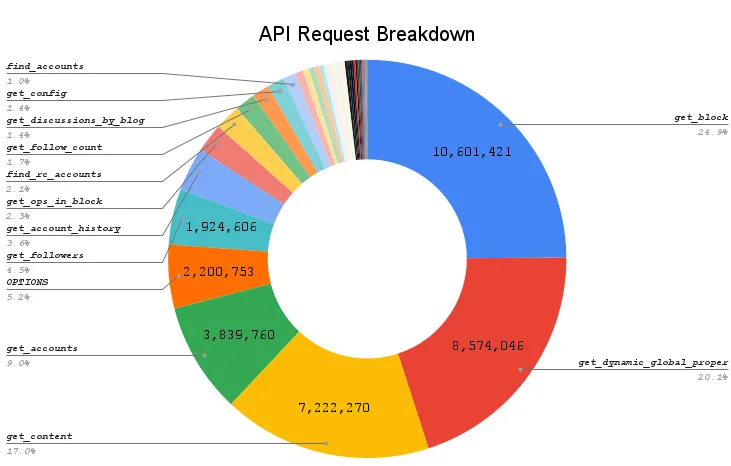
Unsurprising to me, get_block and get_dynamic_global_properties are leading with almost half the traffic together. This is not overly surprising as many services can use these two requests together to "watch" the chain, building their own internal state. Indeed, with just these two requests, you can basically generate any other data yourself -- it's just a matter of how much data you want to store within your service.
The next dominant result is get_content: this is typically what is called from a service like Busy or Steempeak whenever you view a post. get_accounts is likely dominantly used by services like Steemworld, fetching your account data.
An interesting one included here is OPTIONS: while not actually an API call, this is a request sent to the API that is done by web browsers, usually implicitly, so that the web browser sort of understands what it's talking to when it will talk to the API. In this case, you can kind of think of this as a good representation of "Hello, nice to meet you" from a web browser when it first talks to the API from a web page like Busy or Steempeak.
Account history requests (get_account history, get_ops_in_block and get_transaction (which is hardly visible)) are actually not that dominant, though they are still bandwidth heavy. As hivemind requests follow a similar story, it really highlights how not all API usage has "full node" requirements.
Please Support the API!
In my proposal post here, I outlined the details for my proposal to fund this public API infrastructure. The summary is as follows:
This proposal seeks to help reimburse the recurrent costs of the public, free-to-use anyx.io Steem API infrastructure. If you use sites or services such as Busy.org, Splinterlands (SteemMonsters), Partiko, or many more — these services rely on this infrastructure for both uptime and performance.
Please do consider voting for this proposal to help it achieve funding and keep it alive, at one of the links below. It targets 15 SBD per day from the Steem DAO to cover hosting costs, and it's one of the lowest costing proposals. It only takes a second to vote for a proposal, and it does not cost you anything to vote.
https://steemitwallet.com/proposals
https://steempeak.com/proposals