Yesterday @sacred-agent shared a post where Tyler Jenks and Tone go through a chart patterning technique called Hyperwaves, which is essentially a subclass of a Bubble. I'm pretty fascinated.
Technical Analysis
For people that don't trade much there's basically two main ways that people will try to investigate whether an investment is a good idea or not. You can inspect the fundamentals of a business or you can look at what price is doing. For those that like fundamentals it's essentially looking at the books of a company to figure out profit, loss, cash on hand, earnings, EBITDA, and all the other accounting aspects to determine if the company is a solid investment. For those that look at technical analysis it's the rough suggestion that price already includes market knowledge of fundamentals mixed with fear and greed and is essentially a stronger estimate of fundamentals mixed with current sentiment about the investment.
Technical analysts tend to think that fundamental analysis is a waste of time. They think fundamentals are already included in the price on the screen. Fundamentalists tend to think that technical analysis is no better than reading tea leaves or consulting Mrs. Cleo about investment opportunities. They would argue you can't judge future price action by what candlesticks say.
For those that follow technical analysis there are a handful of patterns in hourly, daily, weekly, and monthly charts that stand out as strong indicators of overall price action, which can be predictive of future price action. There seems to be many indicators and patterning approaches to figuring out what price is going to do. Tone has a sequential counting system. In the video linked above Tone and Tyler mention Haejin as a practitioner of Elliot Wave counting, and discuss that as another way to investigate price moves from looking at price charts.
The big picture: hyperwaves as a subset of bubbles
Most people are aware of the term bubble. It means a highly inflated market that is likely to pop with a sharp decline in price. Getting in at the beginning could make someone a fortune. Getting in at the high could lose someone a fortune. Studying trends in how bubbles work would benefit investors. A subset of bubbles is a chart that Tyler made called a Hyperwave.
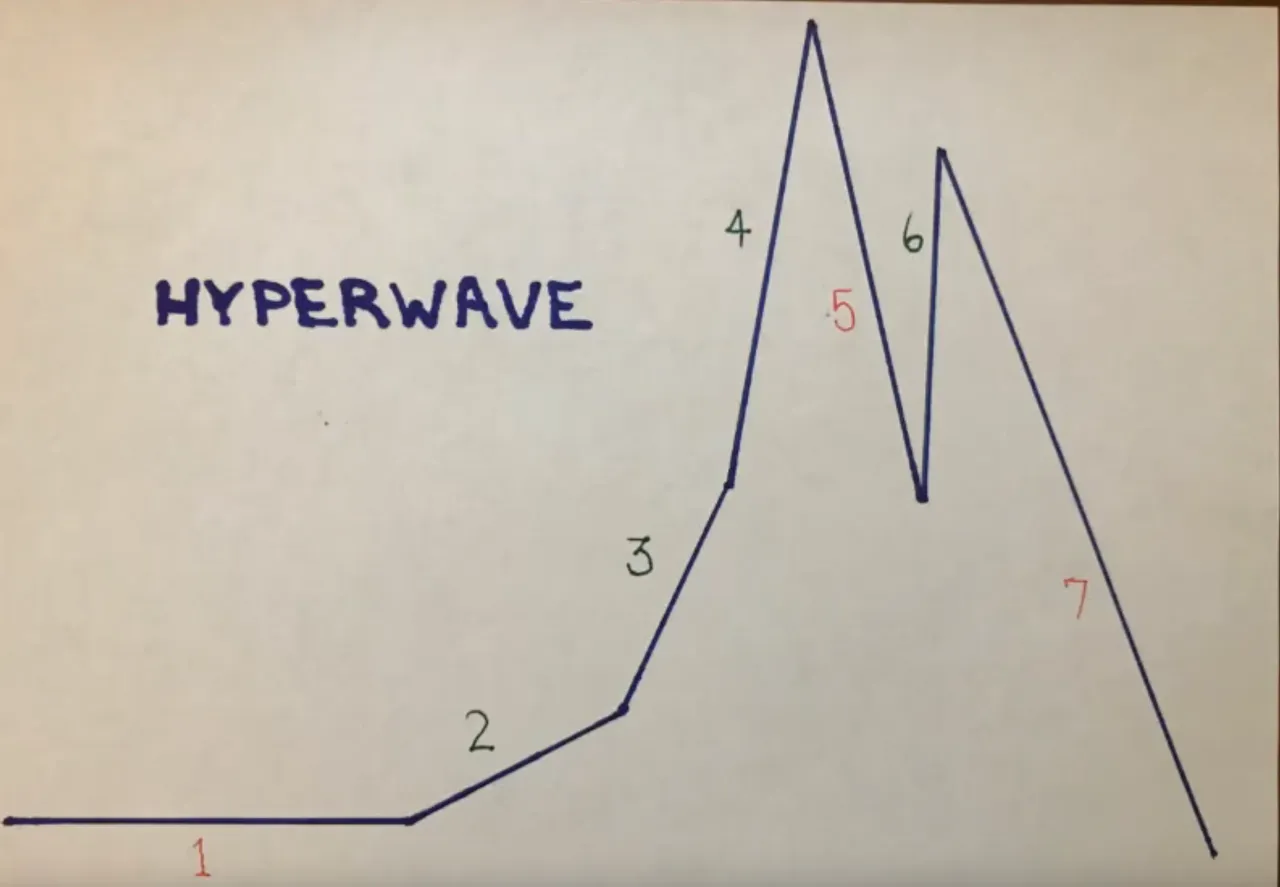
For a hyperwave to fit the bill all price action for red ranges 1,5,7 must stay below the threshold, and for 2,3,4,6 the price must stay above the threshold. It's allowed to thrash about however it wants above or below where appropriate so long as it doesn't break those lines.
Bubbles
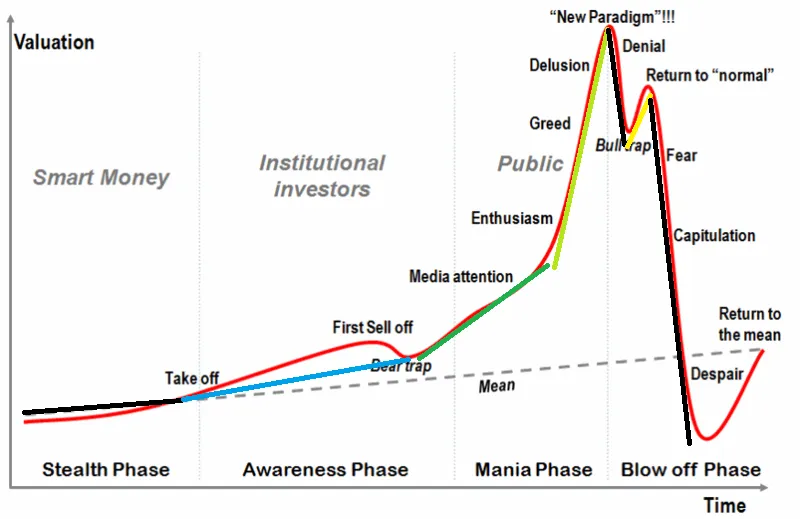
For folks that study bubbles there's a pretty standard chart that folks like to reference:

There's a pretty good similarity between the bubble approach and the hyperwave approach. Tyler mentions that it's better to use Hyperwaves because on a chart with rounded edges it's difficult to know where you are. On a chart that has sharp lines you can tell more easily highs and lows and when trend lines have been pierced indicating large changes in direction.
I've done my best to markup the bubble with Hyperwave lines:
 . The various colors just mark the different stages, but the black lines represent the lines where trending price has to stay below.
Bitcoin
According to Tyler and his theory it looks like bitcoin is in a hyperwave. One might think that we already had the bubble when bitcoin went up to 20k, but that doesn't necessarily appear to be the case. We're at a critical junction point over the next few days as bitcoin seems likely to go well past 20k or drop down possibly as far down as 5-7k (and bounce off of the 2 line) or even down to 1.4k (basically fully crash).

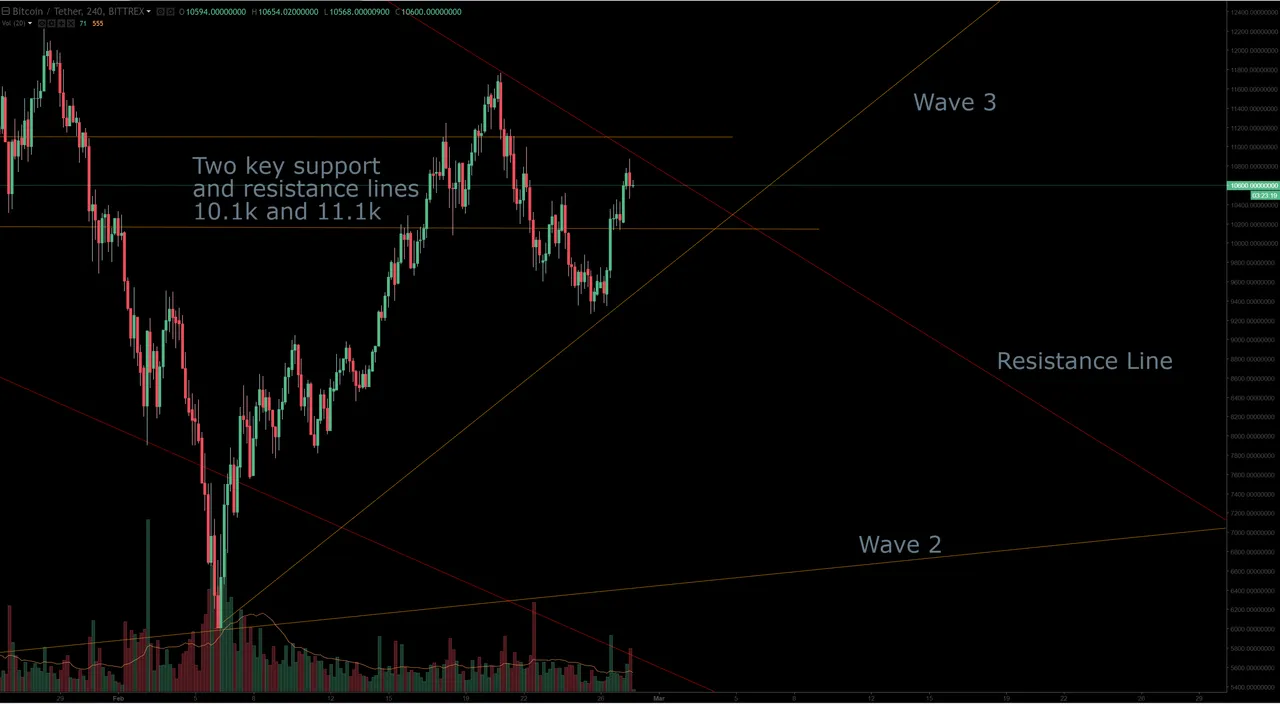
Bitcoin has two tough challenges ahead from a technical analysis pattern and a hyperwave pattern. There's is a resistance line that has held since 20k btc. It's been tested a few times, but Tone declared it usually takes 5-6 hits on a resistance line before it breaks. We haven't seen that many yet.
Additionally, from a hyperwave perspective, bitcoin is up against a possible wave 3 line. If it pierces the line and stays below then either wave 3 hasn't formed or wave 3 just died. It would appear that hyperwaves get a 1/4 shot of making it in wave 2. Those in wave 3 are closer to 4/5 make it through. The question that's looking to be answered over the next few days are: Will bitcoin make it over the resistance line that's been around since 20k btc, will it make it over a critical resistance line of 11.2k and stay above it, and will it stay above the wave 3 hyperwave line. If those conditions are met then it looks promising that bitcoin despite having a recent all time high is barely into wave 3 of the hyperwave and is going to blow away previous all time highs.
if those conditions aren't met then price is likely to fall back to the wave 2 line between 5-7k, or the wave will collapse entirely and die at 1.4k or so (possibly to try again).
What's the deal again?
BTC needs to stay above wave 2, and wave 3, reach over the downward sloping resistance line that's been there since 20kbtc, and rely on the key support/resistance lines at 10.1k and 11.1k btc.
If it fails it could fall back to Wave 2 levels. Or just falter completely and go back to 1k btc levels.
For those looking for hope
For those looking for some hope there's a story from an Elliot wave perspective that bitcoin has recently completed it's first set of impulse waves, followed by a mild correction, and soon to start the most vigorous set of impulse waves that would conceivably have the force necessary to shatter resistance lines and bring bitcoin to new all times highs and still only be in wave 3 of the overall hyperwave. Actually it's really still just the start of wave 3.
Steem
Well, it's likely a moot point if bitcoin fails, and we'll know if bitcoin fails in the next week or so. It'll either be up over 11k or down below 5-7k. That said I was still interested to try to craft a hyperwave chart for Steem and see what it might look like.

To my knowledge that's the first public chart drawn of a hyperwave for Steem. I'm not sure. But if btc holds, then it shouldn't surprise anyone that effected alts could hold, and we might be looking at continuing wave 3 for Steem. This would put the minimum price for Steem through the summer towards 7-10 range, and then assuming wave 4 hits put Steem in a race to a minimum price of 30-50 Steem. This spike would be followed by a bull trap, and then a strong plummet maybe in early 2019.
Hyperwaves are slow; except in crypto
In the presentation I linked at the top Tyler and Tone talk about multiple 40+ year investment trend lines that go through hyperwaves. Tyler says he has over 300 charts that fit the pattern. What's unique about crypto is the time it takes to complete these. The flow of funds is absolutely massive and basically unparalleled in financial history. What takes the stock market 15-80 years to complete a cycle can be done in less than 5 in crypto.
Do I believe these things?
Honestly, I'm not sure. I'm still just reporting what I watched and read for the last 8 hours. I hope it's right, but as Tyler says "Hope is a bad investment strategy." I do think that if bitcoin can get back up to 11-12k it looks very promising for a very healthy recovery.
Investment advice
Guys, I've been trading for like a month. If you trust me to make your financial decisions you frankly deserve to lose all the stake you have. I'm doing my best to learn about technical analysis and decide on whether I like and or trust it. I'm mostly reporting my studies and trying to apply them. This is for my educational purpose. This is for my entertainment. I'm just sharing my journey with you. Do your own due diligence and talk to your own financial advisers as you make financial decisions for you and your family.

People
You can find Tone here
You can find Tyler here