
SUMMARY
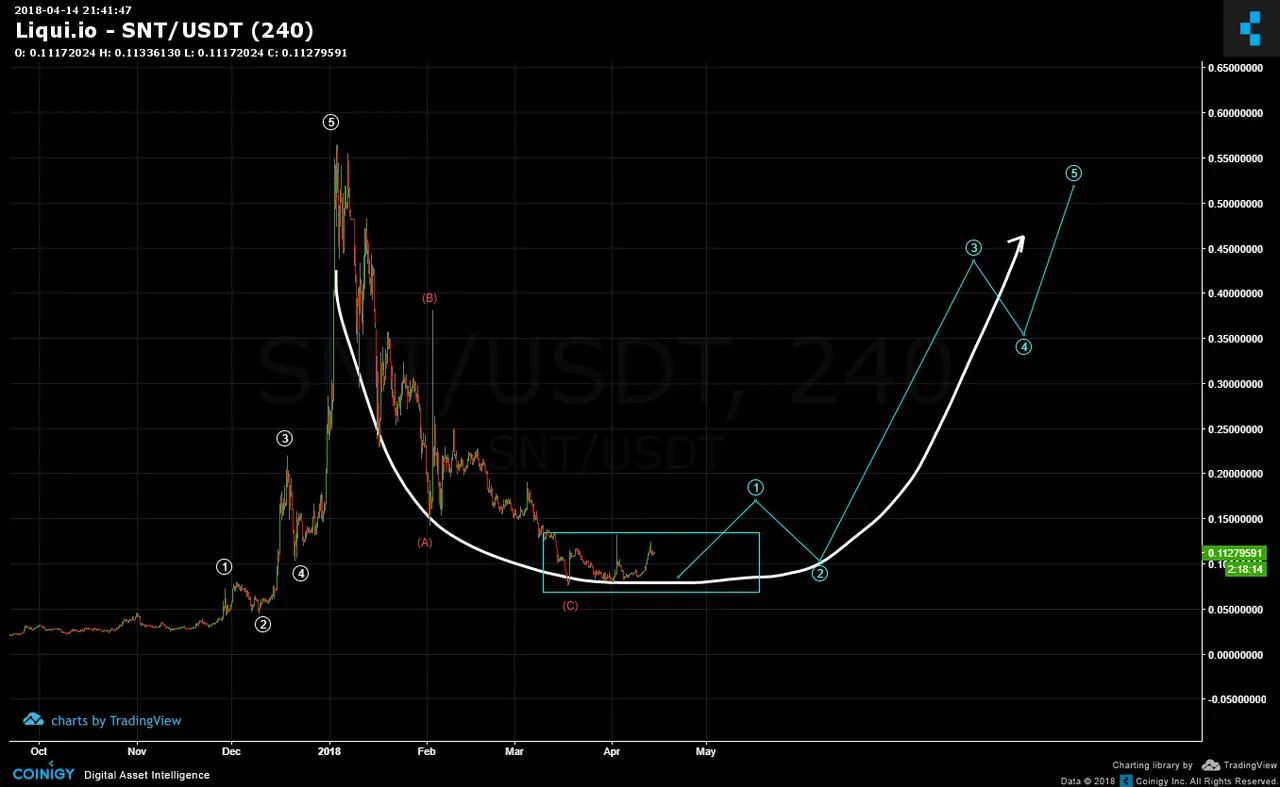
Status (SNT/USD) could soon initiate the price climb to regain it's near $1 Bil market cap. The below chart shows that the contours of the price since late December to current can outline the shape of a rounded price formation. For now, the ABC seems complete but a bit of basin basing might be required.

The blue rectangle shows the basin phase zone and form there the right wall side of the rounded cup formation will likely take place. Since symmetry is key in patterns, it's likely that wave 5 will equal the left wall height.
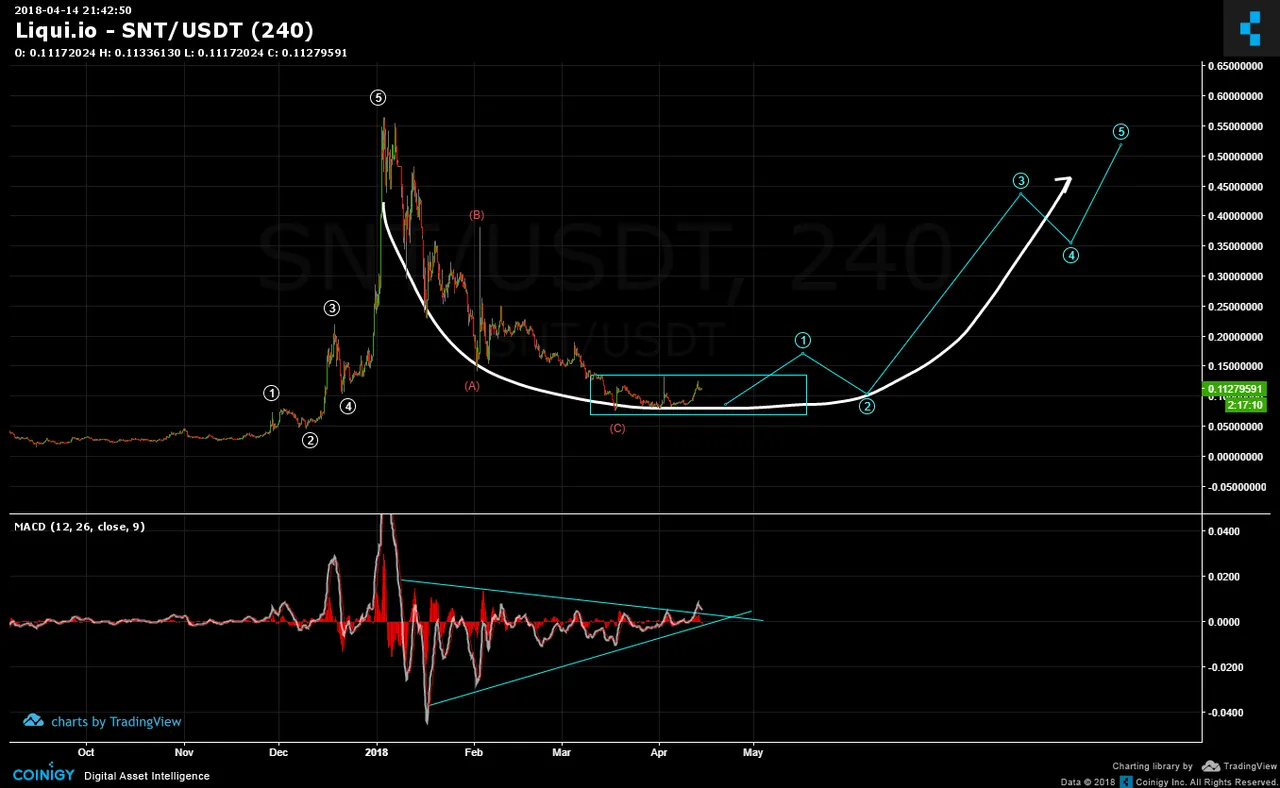
The MACD shows that the breakout from the basin zone could be earlier than expected. IF so, then blue wave 1 could surge in a near vertical scale.
Legal Disclaimer: I am not a financial advisor nor is any content in this article presented as financial advice. The information provided in this blog post and any other posts that I make and any accompanying material is for informational purposes only. It should not be considered financial or investment advice of any kind. One should consult with a financial or investment professional to determine what may be best for your individual needs. Plain English: This is only my opinion, make of it what you wish. What does this mean? It means it's not advice nor recommendation to either buy or sell anything! It's only meant for use as informative or entertainment purposes.
Please consider reviewing these Tutorials on:
Elliott Wave Counting Tutorial #1
Elliott Wave Counting Tutorial #2
Elliott Wave Counting Tutorial #3
Laddering and Buy/Sell Setups.
Laddering Example with EOS
Tutorial on the use of Fibonacci & Elliott Waves
@haejin's Trading Nuggets
Essay: Is Technical Analysis a Quantum Event?
Follow me on Twitter for Real Time Alerts!!
Follow me on StockTwits for UpDates!!
--
--

