I remember the game like it was yesterday A lot of excitement was in the air back in Week 11, 2014 and a lot was at stake. The Colts (6–3) were hosting the Patriots (7–2) at home. Both looking to win to gain control of the #1 seed in the AFC. Everyone understood the importance of this game, and the fact these guys are life long rivals just added more gasoline to the fire.
“If we don’t take care of today, finish up with great meetings, extra film, treatment, rest, eat right, take care of tomorrow, take care of Friday, take care of Saturday, it won’t matter. One game at a time.” — Chuck Pagano (source)
Oh, they ate alright. Ate about 200 yards and four touchdowns from a seldom used running back that left his best days behind him at Notre Dame — Jonas Gray.
Put it like this — I’ve been tracking Red Zone “events” since 2014. These are the sum of either rushing attempts or receiving targets from a player from inside the opponents 20 yard line. Why don’t you just take a gander at the top five in game events of the past two seasons:
| Rank | Player, Pos., Team | Week, Year, Opp. | Combined RZ Events | TD's |
|---|---|---|---|---|
| 1 | Jonas Gray, RB, Patriots | Week 11, 2014, Colts | 13 | 4 |
| 2 | Adrian Peterson, RB, Vikings | Week 2, 2015, Lions | 13 | 0 |
| 3 | Marshawn Lynch, RB, Seahawks | Week 10, 2014, Giants | 11 | 4 |
| 4 | Matt Forte, RB, Bears | Week 6, 2015, Lions | 11 | 1 |
| 5 | Justin Forsett, RB, Ravens | Week 13, 2014, Chargers | 11 | 0 |
Words can’t describe for me as a Colts fan just how demoralizing it was to see Jonas cram it down our throats so much. What makes it worse is that Jonas never accomplished that feat ever again. He was just an interchangeable cog in the monster offensive juggernaut that is the New England Patriots.
It’s like playing against your big brother in Tecmo Bowl and he is always the Raiders. The Colts made Jonas look like Tecmo Bo Jackson.
Outlier, outlier, pants on fire
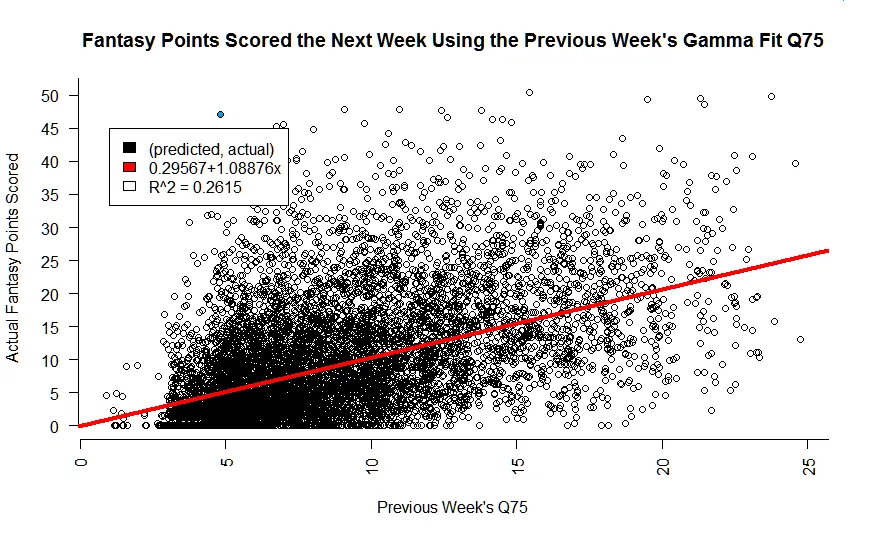
I’ve diagrammed so far in my previous two posts (Part 1, Part 2) a Bayesan approach for generating player performance predictions. The graph below represents every prediction I have made on a player since 2014 against how they actually performed. The red line represents my line of best fit that describes this predictive model. The R^2 score, which we can think of as just another fancy way we gauge the accuracy of the model, is about 0.26, or 26%. Keep that number in mind.
See that pale blue dot in the upper left corner? That’s Jonas Gray. Jonas Gray the OUTLIER!
Have you ever been with a buddy that always wins at a casino? Have you ever met someone that was with someone waaaaay out of their league? Do you personally know Jonas Gray? Congratulations, you are familiar with an outlier.
Jonas, by virtue of being new to the league and not really doing well his prior few weeks was supposed to score 5 points according to my model. Turns out, he actually scores 47.1 against my hapless Colts, for a 42.1 underestimate on my behalf. By all measures of the eye test, this would be considered an outlier performance for Mr. Gray.
How about statistically?
That is a little bit more of a contentious issue. There are seriously entire books written on outliers, not including the non-fiction masterpiece by Malcom Gladwell.
I decided to use the standard definition found in many a high school and college text — that an outlier is a data point that is outside 1.5 * IQR. Allow me to translate, because let’s face it, leaving explanations like that are the reason why people hate math.
Take your data set, put it into numerical order, and divide it in half. The number in the middle is called the Median. Now, take each half and divide in half. The middle numbers of each half are known as the First Quartile and Third Quartile, respectively.
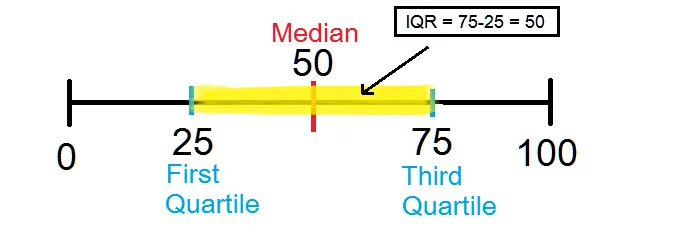
The IQR is the Interquartile Range, or difference, between the First and Third Quartiles. Multiply that by 1.5, and shazaaam! You have an outlier!
For my example above of the whole numbers from 0 to 100, an outlier would be 1.5 * 50 = 75 above or below the median of the data set. Meaning, anything above 125 or lower than -25 would be an outlier. Obviously, there are none here in this particular example.
My data set
Below is a histogram of the differences between how I predict a player will perform versus how they actually perform. Each bar goes up to the percent of the time it happens. For instance, the tallest bar means I am only overestimating a performance by 0–2 points about 10% of the time.
The median of my differences is 1.13. The first quartile is -4.5360, and the third quartile is 4.3040. Applying the 1.5 * IQR rule, outliers exist as follows:
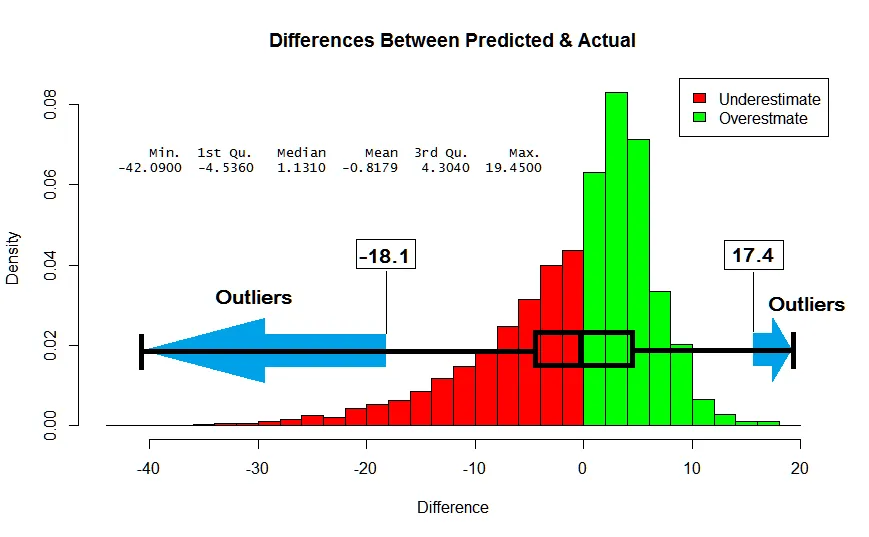
This means that anything outside of a 18.1 point underestimate and a 17.4 point overestimate is nonsensical for our model. We never had a chance of predicting it anyways.
Now, imagine a world where Jonas Gray doesn’t exist
I’ve removed all the Jonas Gray’s from my data set, those outside our 1.5 * IQR. Check out how much cleaner things look now. Most importantly, take a look at JUST how much our model improves:
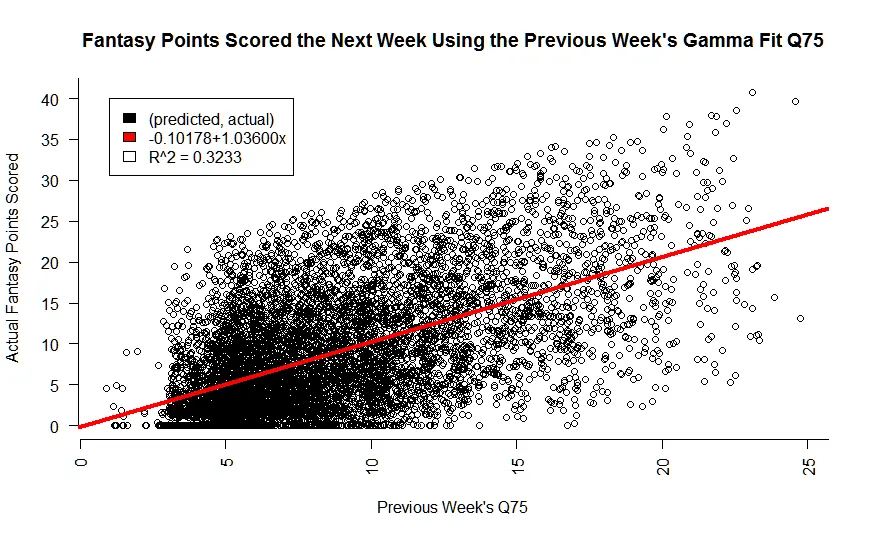
Pretty, ain't she! We went from a model accuracy of 26% to 32%. Just by punting on people that never would have been able to predict anyways. But, does it matter?
Yes, yes it does!
As a demonstration, I honestly picked a random NFL week from last season, Week 15. I ran my simple linear model for the season and removed all outliers. Then I used it to predict how players would do and ran it through my custom built Draft Kings lineup optimizer that also takes the salary of a player into account.
What you are about to see, is something pretty good:
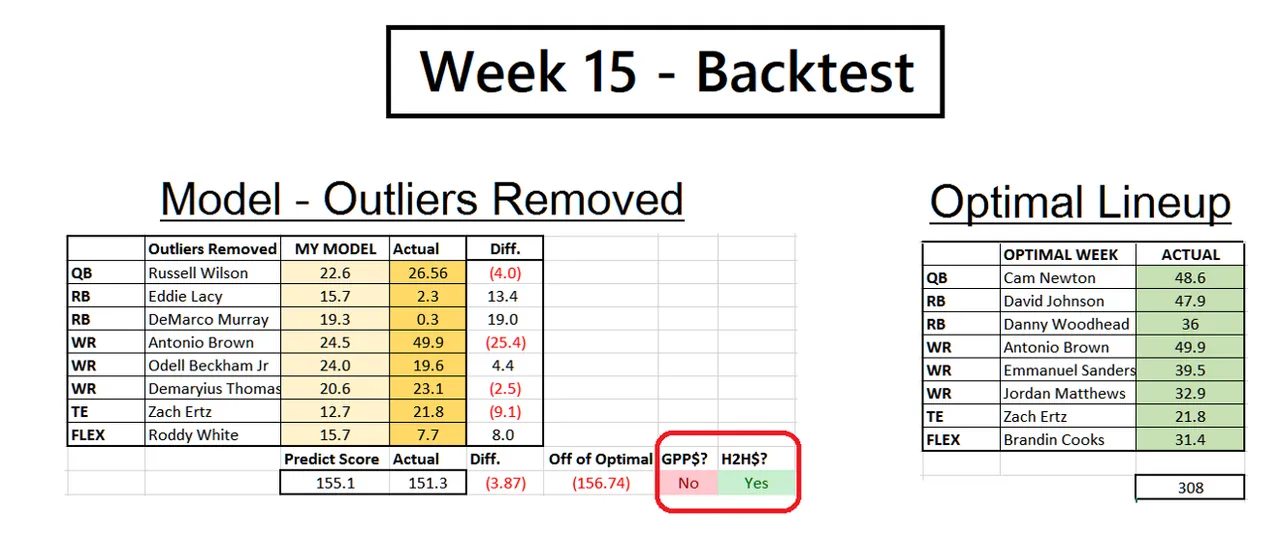
My model selected a team it predicted would score 155.1, not including a Defense/Special Teams. I actually scored 151.3. Got a little unlucky on fat Eddy Lacy and DeMarco Murray, but overall not so bad. In a GPP, or multiplayer tournament, I probably would not have cashed or come very close.
But, in a H2H, or head to head tournament, I would have. Notice I am way off the optimal lineup, but I’m never going to hit that with my model the way it is.
What I am hitting though, is consistency. And that is something that can be built on top of in the weeks to come.
Now what?
Well, we improve! There are several other factors that influence the prediction of a performance and we are just scratching on the surface of them. As a spoiler though, this is one of my recent models using several other high leverage NFL factors.
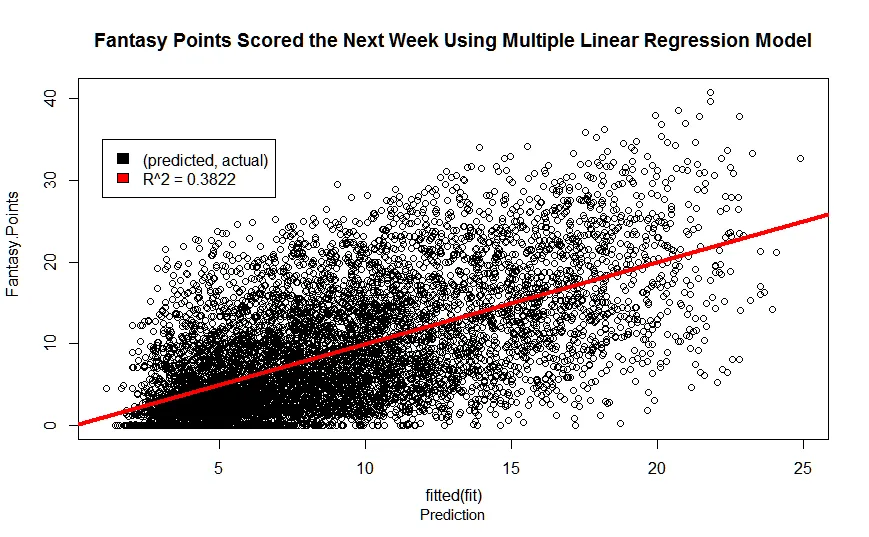
Notice I’m up another 6% in accuracy. Just how exactly? Stay tuned for the next part, where we will perform multiple linear regression and complete our model for the upcoming NFL season!