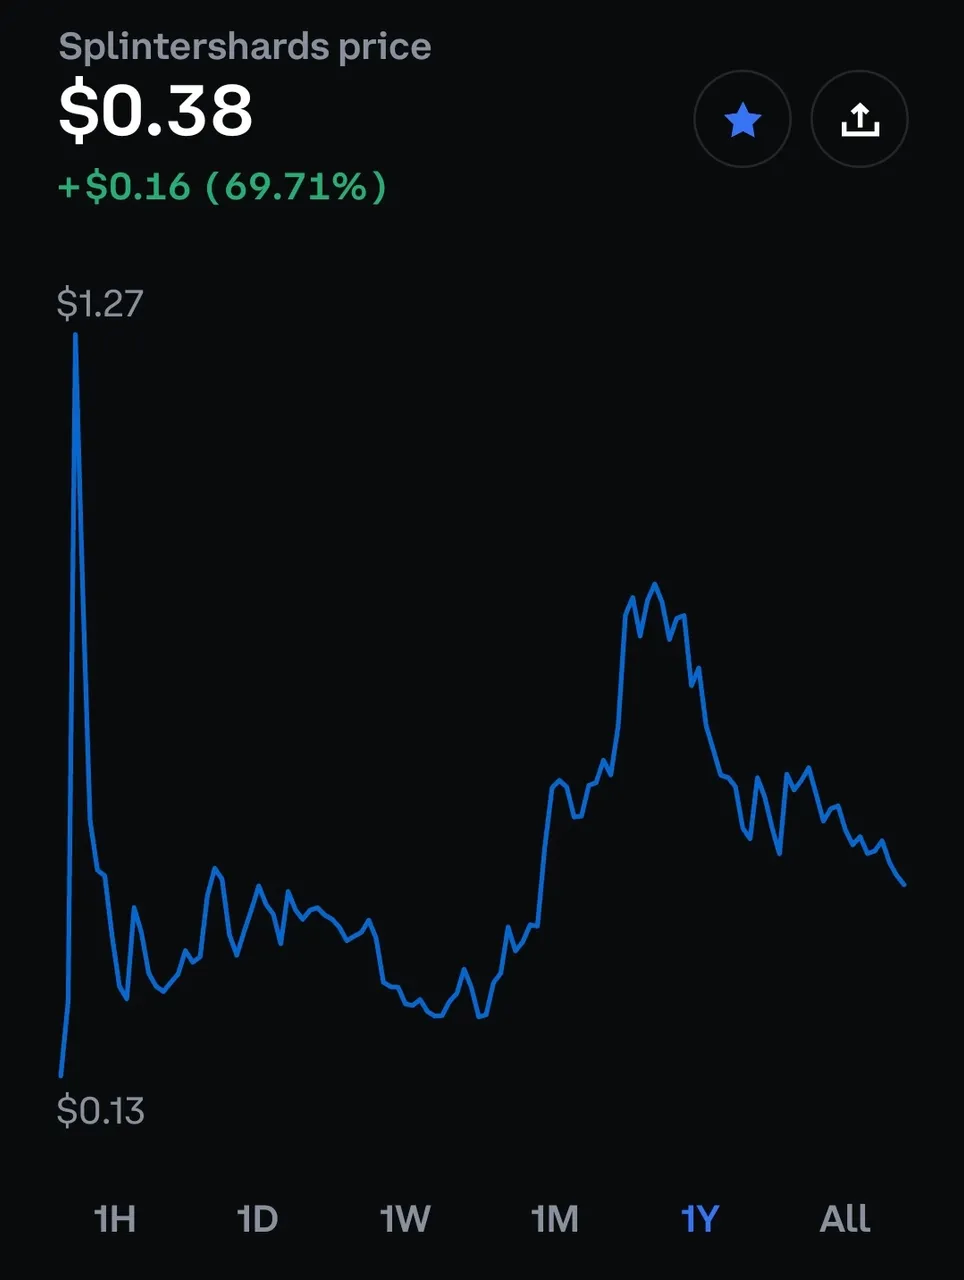
This is a very simple chart, but the shape really shows where we are at, in this point in time. Highs of roughly .90 cents. Formed a little base before the run up in low .20 cent range. Now we have sold off quite a bit since the highs. Some selling could be good. Weve been heated up for quite a while so some selling could be healthy. Is it a good buy yet, or is there more pain to come. Only time will tell.