
SUMMARY
Back in early November of last year, when I had recommended Spread Coin (SPR) at $0.18; I caught alot of jabs from trolls and haters jeering at how I'm hurting others by recommending such a shitcoin. In my 20 years of Technical Analysis experience; one of the greatest lessons learned was to always think on my own. SPR went on to tag $3.78 or 1,786% profit!! I actively avoid reading others' technical analysis not because they are not good enough, but only because I don't want my perceptions to be influenced. I'm only human and so not perusing others' analysis allows me to be silo'd to only generate my own analysis with zero outside influence.
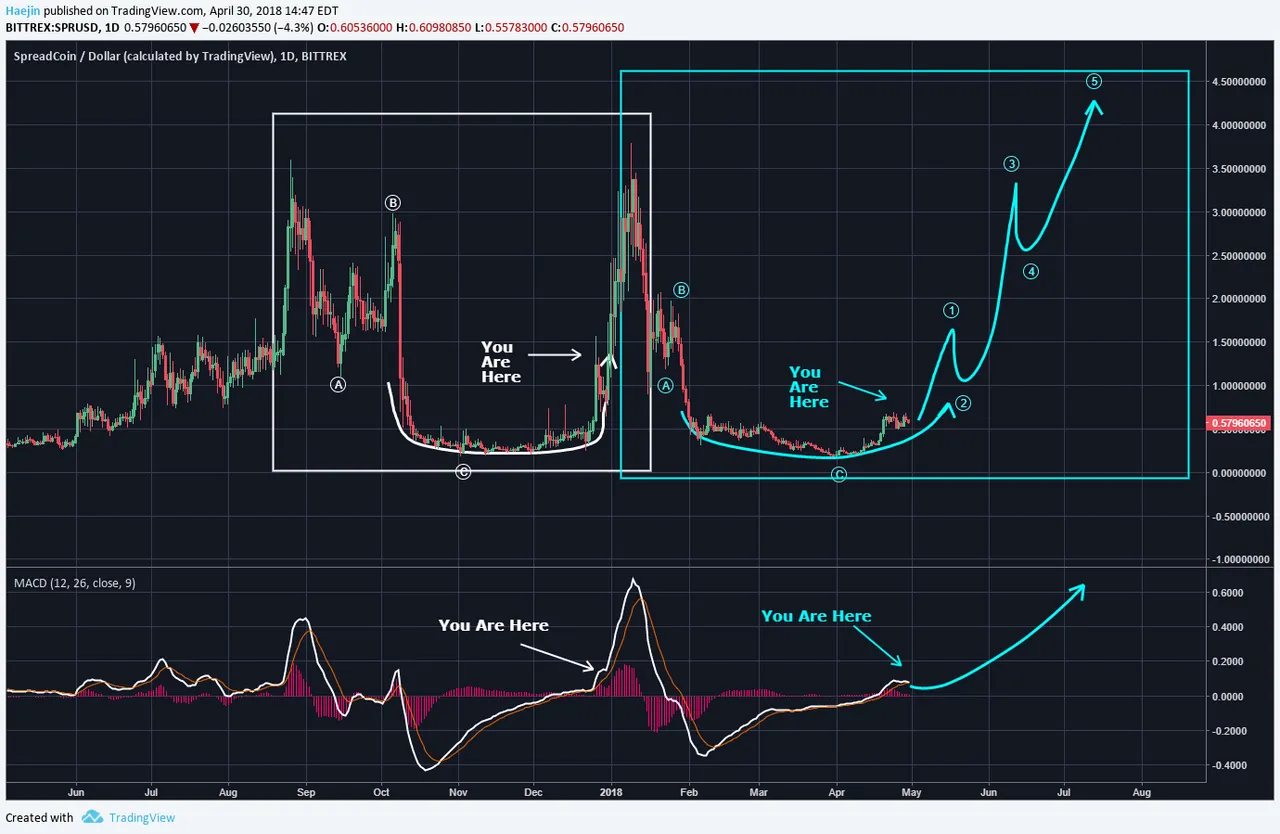
Analogous fractals can be very powerful so learning how to identify them and utilize their pattern guidance can help you land at more profitable footings. The below chart shows the white box fractal with a distinct ABC correction and a rounded price formation. The same can be seen for the blue box; up until the point of the near completion of the rounded formation. The "Your Are Here" markings show a very high degree of similarity between the fractals!

I've filled in the rest of the blue fractal and it looks very bullish! IF correct, a new all time high can be hit! Price will clearly run up in an impulse motive (blue waves). The MACD also parallel well the fractals and thus an upside should occur very soon!
Legal Disclaimer: I am not a financial advisor nor is any content in this article presented as financial advice. The information provided in this blog post and any other posts that I make and any accompanying material is for informational purposes only. It should not be considered financial or investment advice of any kind. One should consult with a financial or investment professional to determine what may be best for your individual needs. Plain English: This is only my opinion, make of it what you wish. What does this mean? It means it's not advice nor recommendation to either buy or sell anything! It's only meant for use as informative or entertainment purposes.
Please consider reviewing these Tutorials on:
Elliott Wave Counting Tutorial #1
Elliott Wave Counting Tutorial #2
Elliott Wave Counting Tutorial #3
Laddering and Buy/Sell Setups.
Laddering Example with EOS
Tutorial on the use of Fibonacci & Elliott Waves
@haejin's Trading Nuggets
Essay: Is Technical Analysis a Quantum Event?
Follow me on Twitter for Real Time Alerts!!
Follow me on StockTwits for UpDates!!
--
--

