September 4th 2021, Silver Chartbook – Silver, the big picture
We have all heard it, and we have all done it—the typical mistakes of trading. We ran stops, over traded, shadow traded, ignored probabilities, traded too large, and revenge traded. In addition, we ignored even the bluntest signals the market sent, like ill-liquidity, volatility, and chop. What is a lot less spoken about is the lack of a big picture. Yet, ignoring the larger time frame players who rule and steam over small-time frame setups is one of the most detrimental influences on your trading if ignored. Silver, the big picture.
The problem stems from the difficulty of prediction. The further an event is in the future, the harder it is to predict. This fact lures amateurs to the smaller time frames in the desire to be correct. In addition, trade frequency is higher the smaller the time frame regarding signal generation. That makes smaller time frames more alluring since there is more action. Nevertheless, the long-term plays provide for the big profits and regarding silver physical acquisition right now is favorable.
Silver in US-Dollar, Monthly Chart, Silver, the big picture:
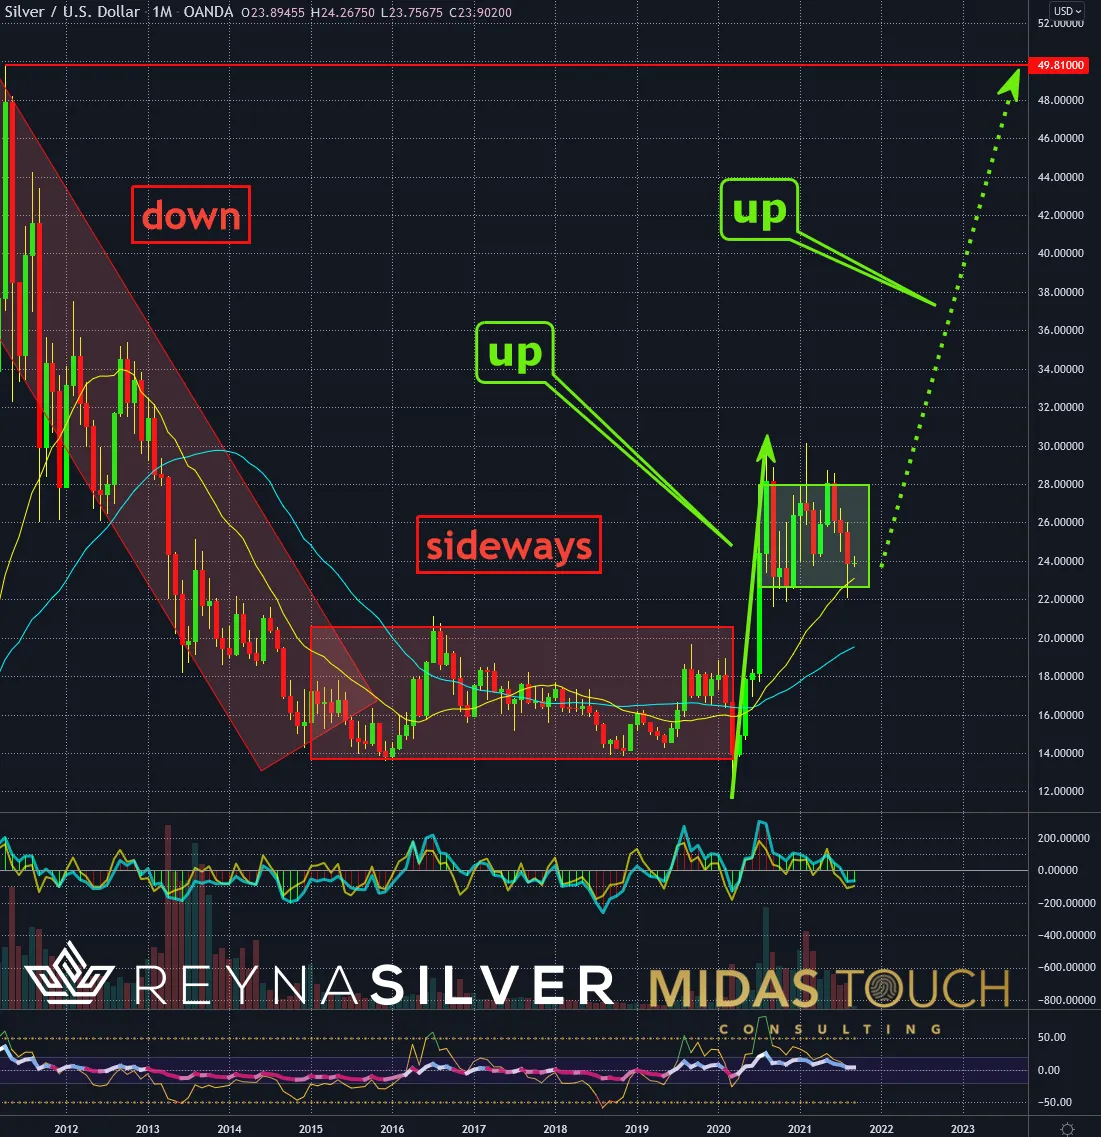
Silver in US-Dollar, monthly chart as of September 3rd, 2021.
We find traditional value in a fundamentally large time frame analysis first. A story, if you will, that supports what charts are showing us. Regarding the monthly view above, we nearly had a decade where metals weren’t favored, which ended with last year’s lockdown. The lesser talked about underlying current for a bullish narrative is that many raw materials are needed for the decarbonization process. Consequently, in addition to inflation and a supply to demand disbalance, we have another reason for continuing this first burst to new highs. With news shining a light on the neglected commodity sector as a whole and silver especially, we will also see at these lower levels after the new highs to be attractive to investors woken up by news and trying to step in here for cheap.
Silver in US-Dollar, Monthly Chart, great risk-reward ratios:
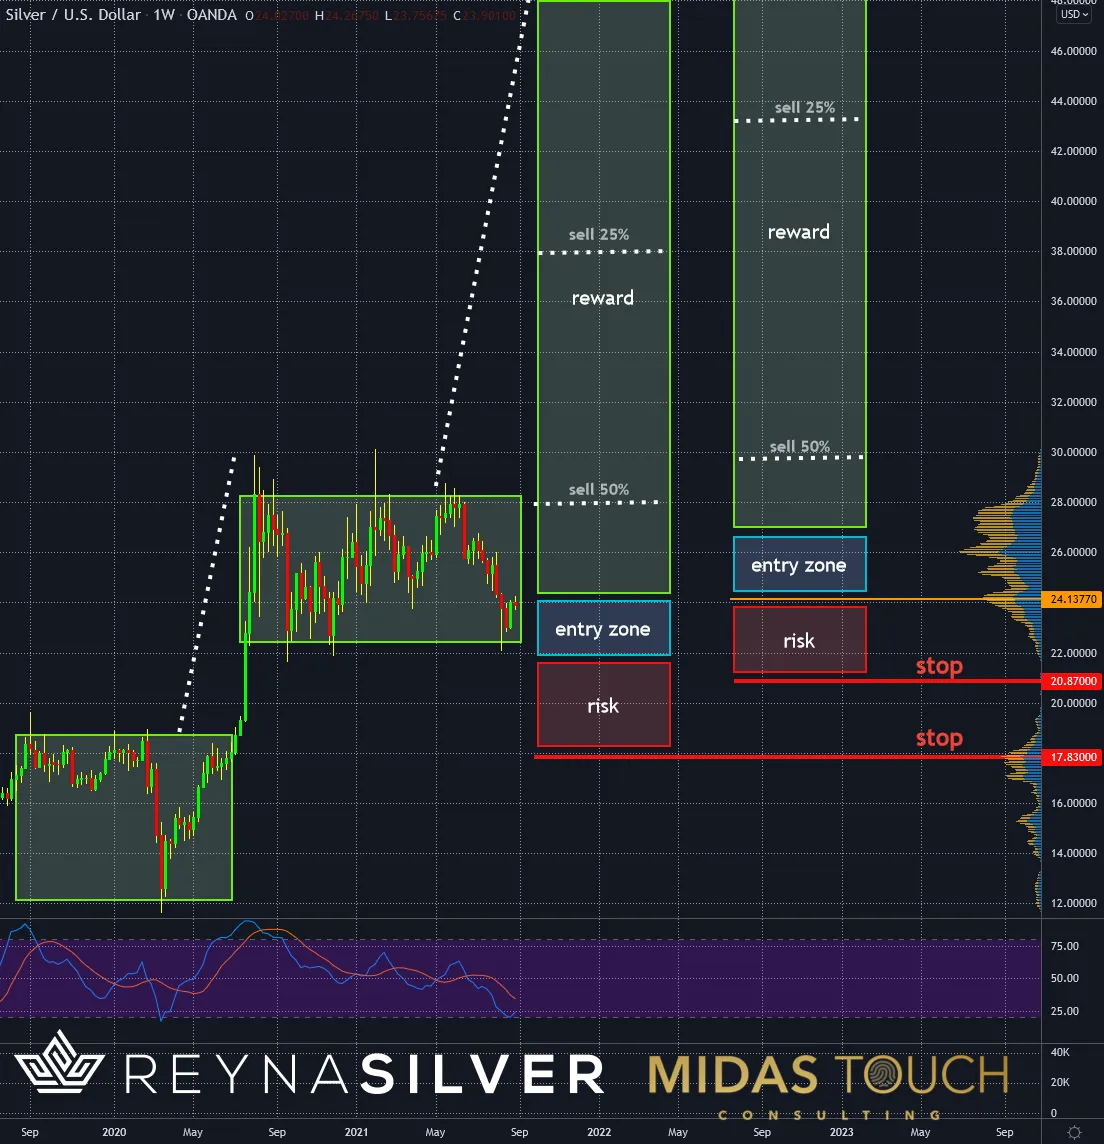
Silver in US-Dollar, weekly chart as of September 3rd, 2021.
Another aspect we find significant from a more broad view is that due to new Covid variants, another lockdown is a possibility. Consequently, this is a probability for another trigger point. Precious metals might shoot out of their last 13 months range to reach new all-time highs.
The chart above shows projections that allow for guesstimated risk/reward-ratios on entries into the silver market. It does so from a perspective of a hedge against inflation, and a general wealth preservation option for the long term.
You can make out that both scenarios of trading anticipatory below US$24, or confirmed above US$24 have a risk/reward-ratio toward the first financing point of about 1:1. at the moderate and aggressive highs of the last thirteen months range (see our quad exit strategy). The second target would be at just below US$38 and US$43.50. As always, we would let our runners (the last 25% of the initial position) run without a trailing stop methodology.

Silver in US-Dollar, Daily Chart, Anticipate, execute, take profits:
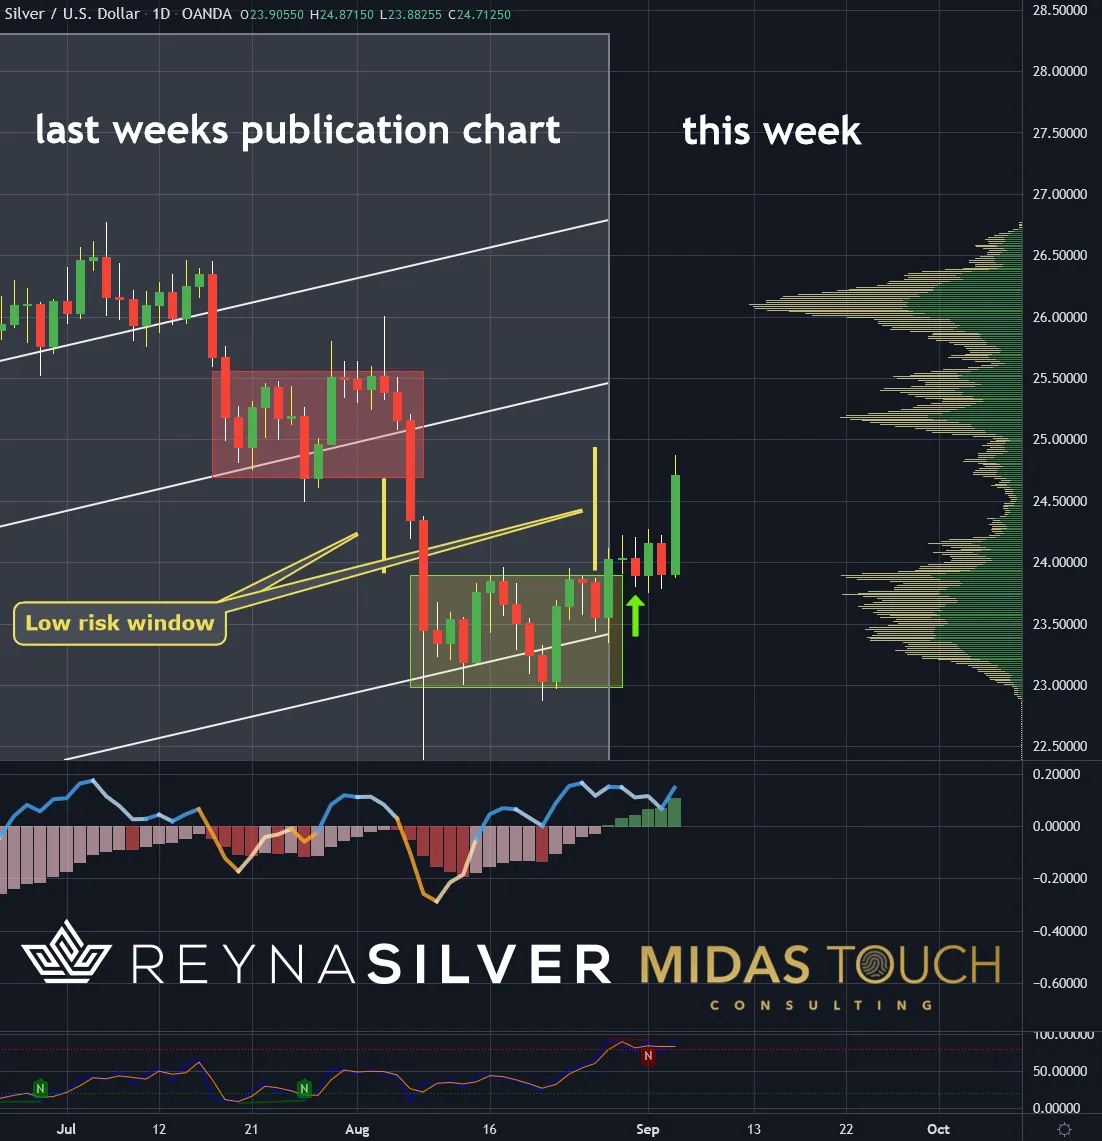
Silver in US-Dollar, daily chart as of September 3rd, 2021.
An important factor in market speculation and, possibly, one of the top three aspects supporting the principle why the larger picture is so essential for a speculator is that the market tries to preempt the future. While we typically follow suit with action in a reactionary way in market play, it is essential to anticipate versus fact proof. This timing from a psychological factor needs this story from the removed larger perspective to support a trader’s action. Proper trade execution is near futile without the conviction on why to nourish a trend with one’s money.
The daily chart above shows a chart we posted last week when we anticipated a long move under the following premises at the time: “We can see that we have entered into a short-term, low-risk advancement window after Friday’s strong close. For one between US$24 and US$24.50, the price finds itself not obstructed by a support/ resistance zone. Secondly, from a fractal volume analysis point (green histogram to the right of the chart), prices can also advance easier between the prices of US$23.90 and US$ 25.15. There are two edges derived from this data. A significant fending off the low range from US$23 to US$24 will make a strong point for higher timeframes if this month closes above US$24.25 and a bullish tone for the upcoming week.”
We placed a trade (green arrow up), sharing that data in real-time in our free Telegram channel, and our predictions came true. Consequently, we took partial profits on Friday at US$24.80, based on our quad exit strategy.
Silver, the big picture:
Silver is more than fifty percent below its all-time highs. In relationship to gold, it is the most undervalued precious metal with an excellent risk/reward-ratio. As a safe haven wealth preservation tool, it is also the most undervalued investment opportunity compared to bitcoin, which trades at US$50,000, slightly below its all-time highs. In the price zone right now, we find below US$25 silver to be in a low-risk entry zone with a desirable risk/reward ratio.
Feel free to join us in our free Telegram channel for daily real time data and a great community.
If you like to get regular updates on our gold model, precious metals and cryptocurrencies you can subscribe to our free newsletter.
This article does not contain investment advice or recommendations. Every investment and trading move involves risk, and readers should conduct their own research when making a decision.