August 20th 2021, Silver Chartbook - Important patterns for silver
Typically, professional market players spot early warning signals that the overall market might be topping by the following sequence. First, the housing market starts to flatten out. Next, investors clean out their portfolio of the small stuff, hence the Russel 2000. And finally, the major indices like the S&P and the Dow roll-over. This time around, we do not only have inflated markets, but multiple market cycles overlapping. It includes a hundred-year cycle of a possible change of the leading world power position and a wealth transformation. What does this mean for wealth preservation timing? Important patterns for silver.
It might be different this time around because the housing market isn’t your best bet as the earliest warning signal. With possible hyperinflation on the horizon, the housing market as a “money to commodity” transfer might be lagging.
Consequently, we have to look at the Russel 2000 first:
Russell 2000 in US-Dollar, Monthly Chart, Early warning signals already present:
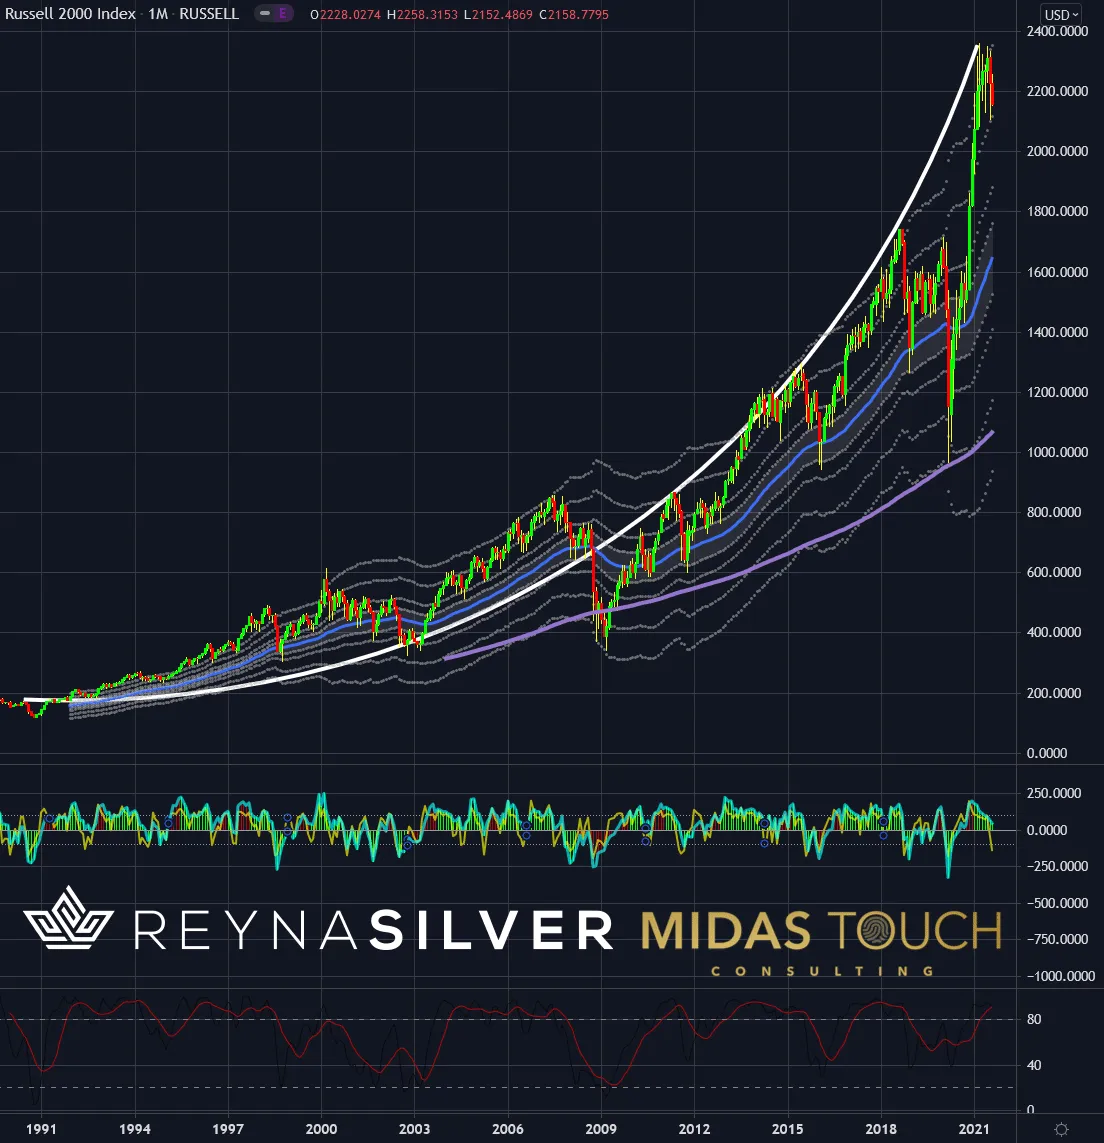
Russell 2000 Index in US-Dollar, monthly chart as of August 20th, 2021.
What also might be different is that typically, greed changes to uncertainty and uncertainty changes to fear. It means that markets trade up, then sideways, then down. Be alerted this time that human nerves are already frail. People struggle to make ends meet, and the limitations due to Covid have strained personal lives. It could mean that we might not see a typical roll-over, but rather an exuberant top and a sharp reversal from greed to fear without the usual sideways reaction time.
The monthly chart above shows what’s typically called a blow-off top from a very steep, sharp move up (from US$966 in March last year to US$2,360 in less than twelve months, a 144% move), that could collapse anytime. The double top formation right now could very well develop in a down move.
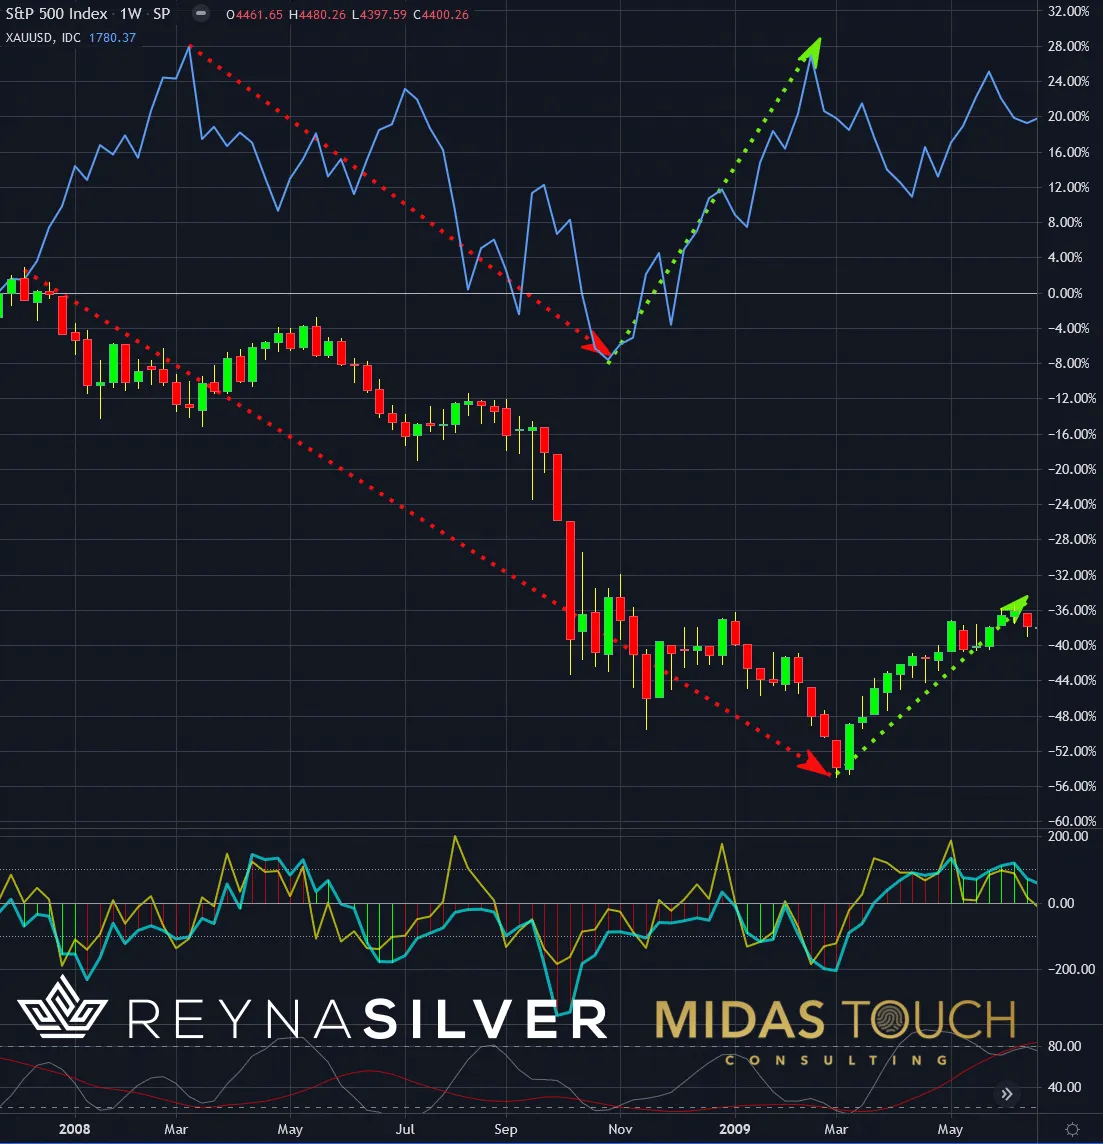
Weekly Chart, Gold to S&P 500 comparison, Quick recoveries in troubled times:
Gold to S&P 500 index comparison, weekly chart 2008-2009
If we see a sharp market decline, precious metals are typically drawn down due to margin calls needing to be covered by freeing liquidity from this sector. However, once gold and silver find their bottom, they tend to rally early out of which a more robust and longer-term uptrend can emerge.
The weekly chart above shows that in the last market crash in 2008/2009, S&P500 prices fell dramatically and dragged gold (blue line) down as well. But then gold turned up from its double low in late October and early November 2008, way earlier than the S&P500, where prices continued to decline for another five months.

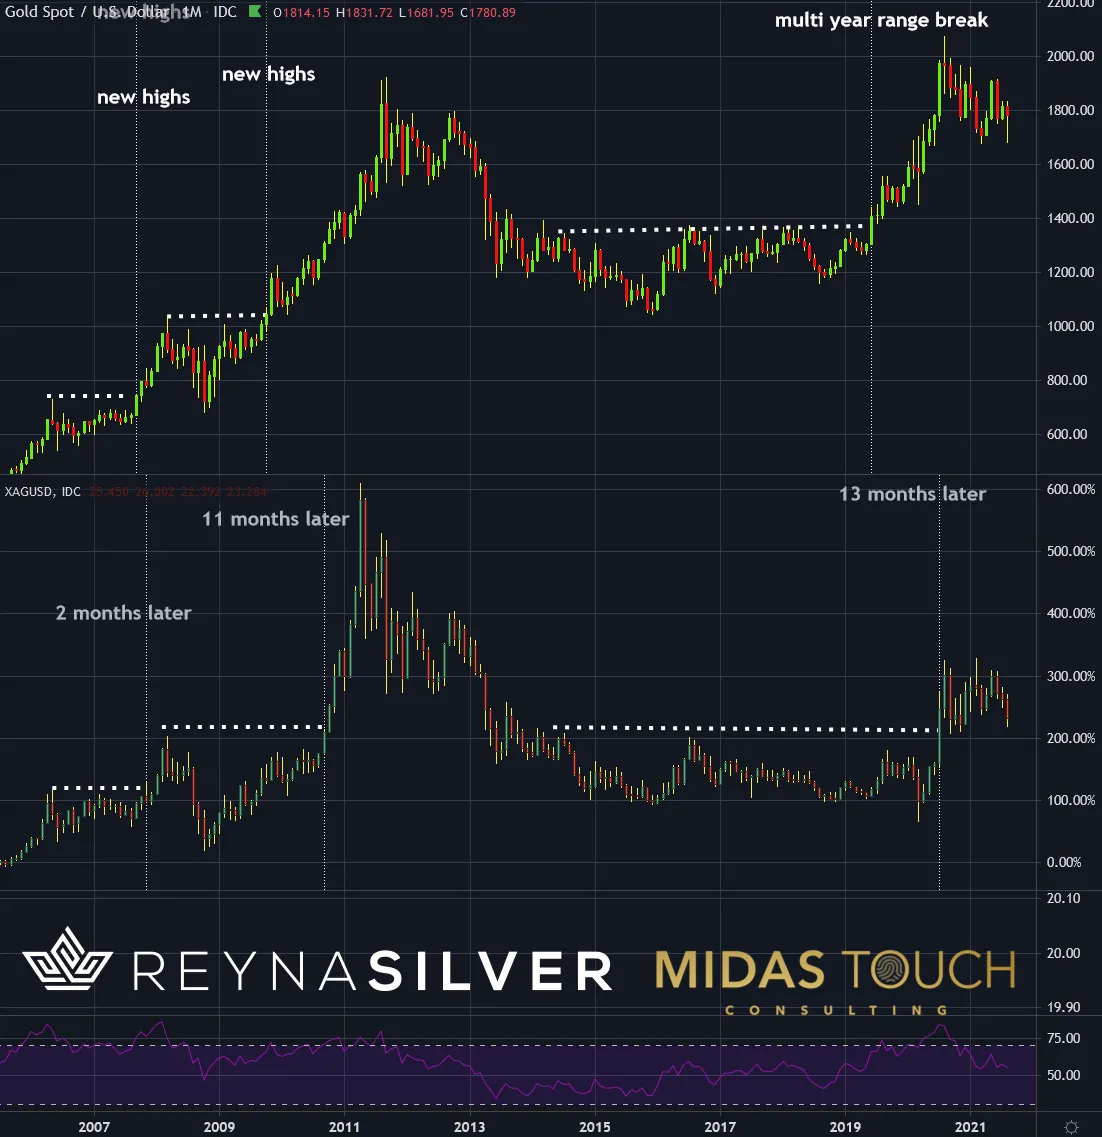
Gold to Silver comparison in US-Dollar, Monthly Chart, Gold, a leading indicator to silver:
Gold to Silver comparison in US-Dollar, monthly chart as of August 20th, 2021.
Another unique pattern is the delay between the gold to the silver move. When gold breaks out, it takes a while till silver follows, a great way to time ones’ positioning into the silver market. With silver providing more bang for the buck (=percentage moves), it is an ideal trading instrument to, besides holding it physical long term, trade it as a “booster” within one’s wealth preservation portfolio.
The chart above shows how gold breakouts are followed by Silver breakouts with quite some time delay. Consequently, gold on the longer term time frames is a leading indicator for timing silver entries.
Gold in US-Dollar, Monthly Chart, waiting for the signal:
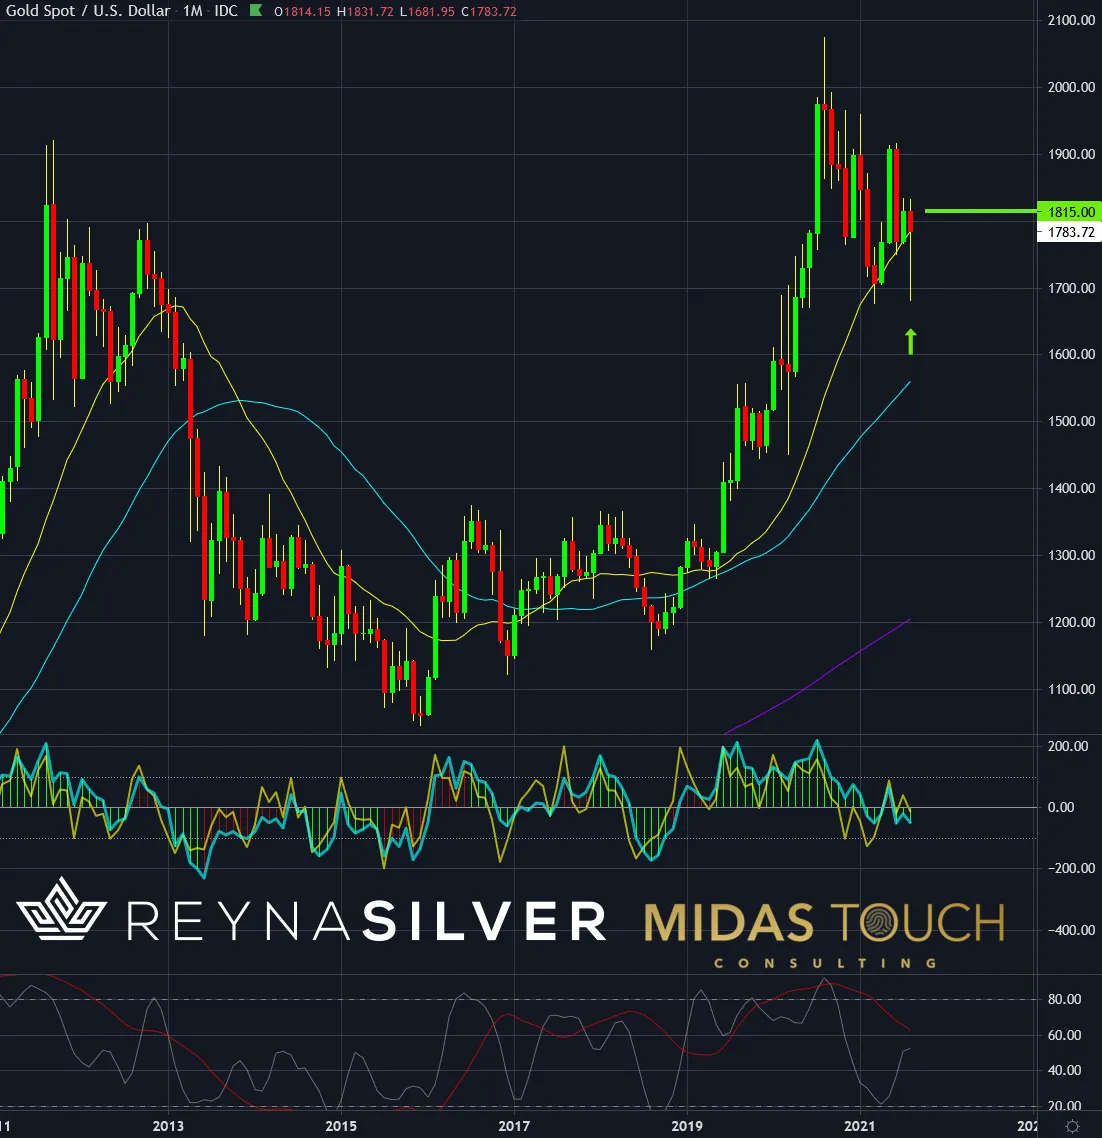
Gold in US-Dollar, monthly chart as of August 20th, 2021.
Regarding timing, we see gold as the leader within this next turning point, and as such, silver is timed alongside once gold has shown solid confirmation of a larger time frame cycle long entry.
That being said, we would want a gold price trading above US$1,815 in September and then prices of silver building a low-risk entry pattern on a weekly chart with prices above US$23.23 for long entry considerations.
You will find more detailed silver entry setups for September coming up in our future weekly chart book publications.
Important patterns for silver:
We wish market play would be as simple as providing support and a resistance line, simply stating: enter here at…, and get out here at… Many try to make you believe just that, but this chess game is more complex and requires market observation. With your family’s future at stake in exceptional times, we find each minute given to market education time not wasted. We try to support you in demystifying the markets and hope you find your profitable patterns to identify low-risk opportunities.
Feel free to join us in our free Telegram channel for daily real time data and a great community.
If you like to get regular updates on our gold model, precious metals and cryptocurrencies you can subscribe to our free newsletter.