Function-as-a-Service or serverless computing is rapidly becoming the gold standard.
It's more cost-effective, scalable, and has much lower downtime than traditional servers.
As a project manager, it can be difficult to track all the different functions and applications running on cloud architecture.
Use this easy to follow guide to learn about some of the best ways to monitor and troubleshoot Lambda programming.
AWS CloudWatch
CloudWatch is a free service provided by Amazon to all AWS users. It automatically monitors your AWS resources and all the applications you run on them. It collects and compiles data and metric information to help you understand how your applications are functioning.
One of the things Amazon touts about CloudWatch is its customizability. You can create custom metrics, monitor CPU usage, and view things like request and error rates in your applications.
It allows you to get a system-wide view of everything taking place in your AWS applications.
AWS X-Ray
Collecting data is just the first step in running a serverless computing architecture. X-Ray provides you with lots of tools to identify issues and analyze the performance of your applications. It helps you better make sense of the raw data CloudWatch provides.
Using X-Ray allows you to follow single or multiple requests on your application. You can check out detailed information about the request itself, how your application responded, and other resources called upon.
This is extremely useful when trying to troubleshoot or optimize your application. The data provided by X-Ray includes application calls on things like:
- Microservices
- Databases
- HTTP Web APIs
You can also use the trace data from X-Ray to generate detailed service graphs. These will show you the client as well as the front- and back-end services that your application uses to process requests and data.
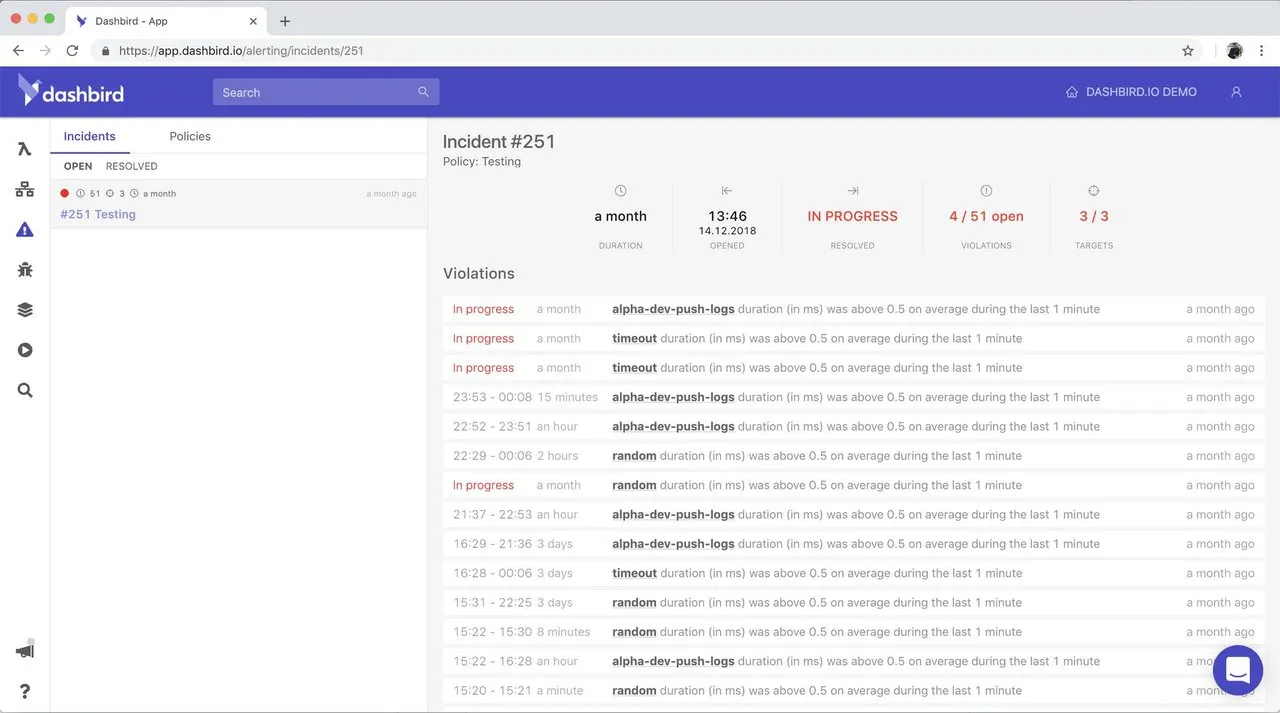
Dashbird.io - a free to use tool to monitor your Lambda functions
While Amazon provides you with a number of useful tools for AWS troubleshooting and monitoring. Many users prefer something a bit more optimized and easier to understand. Dashbird can help streamline the debugging, monitoring and analysis process of your serverless applications.
It allows you to access all the needed logs and other information in one convenient location. At a glance, you can learn the status of your applications, how many resources they're using, and any issues that have come up.
One of the most useful features provided is failure detection and alerts. If there are any configurations errors, crashes, early exits, or timeouts the system will alert you automatically. Out of the box, it works with every language supported by AWS Lambda. Oh, Dashbird just released their new and improved Alerts screen that you'll love to use! It's soooo pretty <3!
It also provides you with full slack integration. From a project management standpoint, this couldn't be more useful. It automatically notifies developers and troubleshooters through Slack making it easy to get the issue in front of the right person, right away.
Dashbird also keeps persistent data logs for 30 days. This makes identifying errors and troubleshooting much easier.
Do Serverless Computing Right
Going serverless is one of the best ways to lower costs and reduce downtime. Lambda programming requires a different mindset than that on traditional servers. It's important to know how to properly monitor and troubleshoot your information.
If you'd like to declutter your AWS monitoring setup, I'd strongly suggest you check out Dashbird.io.