
On publish0x platform, you can change tipping % and this is the last visualization, 80% author and 20% me.
Publish0x is a Free ETH tipping blogging platform and I was hoping to find some interesting tipping strategy for doing this visualization.

- 20% to author / 80% to me (Result here)
- 50% to author / 50% to me (Result here)
- 80% to author / 20% to me (This post)
to see how ETH tipping value is going to be affected.(also BAT and LRC tokens)
80/20 is my default tipping % because I don't have to move the slider up and down.

It is just too much work me to slide this for each post I want to tip, and also I think if I like a post, author deserve get most of the tip. (and i want something for tipping 🤣)
But anyway, here is the data I collected for this post.
# 80/20
tipping_data = {
    '1': {
        'eth': [0.00003438, 0.00000871],
        'bat': [0.0139],
        'lrc': [0.0096, 0.0096, 0.0097, 0.0097]
    },
    '2': {
        'eth': [0.00001311, 0.00000655, 0.00000655, 0.00000648, 0.00000648],
        'bat': [0.0052],
        'lrc': [0.0297]
    },
    '3': {
        'eth': [0.00002987, 0.00001493, 0.00000747],
        'bat': [0.0062, 0.0061],
        'lrc': [0.0076, 0.0076, 0.]
    },
    '4': {
        'eth': [0.00003259, 0.00000827, 0.00000827],
        'bat': [0.0065],
        'lrc': [0.0185, 0.0094, 0.0092]
    },
    '5': {
        'eth': [0.00003269],
        'bat': [0.0127, 0.0063],
        'lrc': [0.0089, 0.0089, 0.0095, 0.0095]
    },
    '6': {
        'eth': [0.00003415, 0.00001708, 0.00000854, 0.00000850, 0.00000850, 0.00000809],
        'bat': [0.0066],
        'lrc': []
    },
    '7': {
        'eth': [0.00001641, 0.00000821, 0.0000809],
        'bat': [0.0063, 0.0063],
        'lrc': [0.0318, 0.0079]
    },
}
Feed this data into my python plotly script. Looks like this 👇
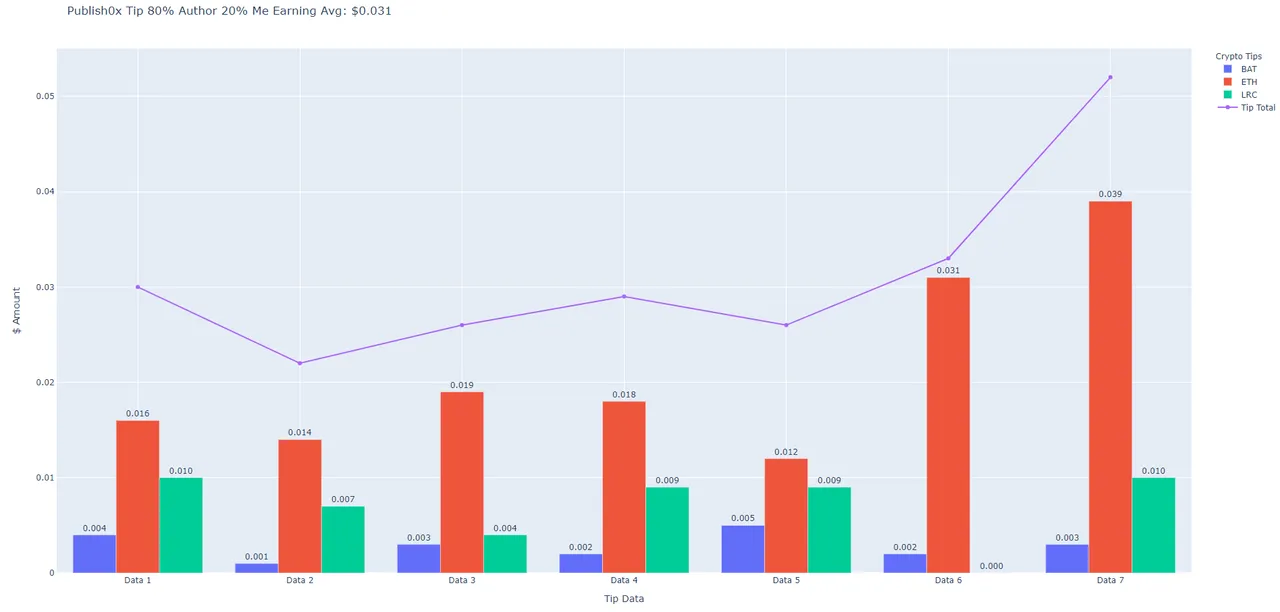
You can also see the graph here.
https://floating-meadow-28045.herokuapp.com/chart-80-20
https://tomoyan.github.io/chart-80-20
Tipping earning avg is about ~$0.03 a day.
This was the week that ETH and all the other coins went down so if it were up, the daily avg could have been more than $0.03, but still an improvement from $0.02 a day 😂 4 months ago.
Publish0x used to change payout coins depends on how you tip, how much you tip so that if you do 80/20, you would BAT more than other coins, or 20/80 you would get more LRC...etc and stuff.
But when Publish0x implemented ETH tipping, I guess they change the payout so that you will get more ETH than any other coins regardless of how you tip.
Damn, there is no tipping hack or trick that I could find 🤣
Maybe they will change this in the future... so I might try this again some time.
If you are interested in Publish0x
Join here 👇 You can use their payout to Power Up 😉
Here is the script for the chart.
from tip_data import tipping_data
import plotly.graph_objects as go
import requests
import statistics


def get_price(id):
    # Call coingecko API to get usd price
    base_url = 'https://api.coingecko.com/api/v3/simple/price'
    eth_url = '?ids=ethereum&vs_currencies=usd'
    bat_url = '?ids=basic-attention-token&vs_currencies=usd'
    lrc_url = '?ids=loopring&vs_currencies=usd'

    if id == 'ethereum':
        try:
            r = requests.get(base_url + eth_url, timeout=3)
            r.raise_for_status()
        except Exception as err:
            print("Exception Error:", err)
            return 0.0
    elif id == 'basic-attention-token':
        try:
            r = requests.get(base_url + bat_url, timeout=3)
            r.raise_for_status()
        except Exception as err:
            print("Exception Error:", err)
            return 0.0
    elif id == 'loopring':
        try:
            r = requests.get(base_url + lrc_url, timeout=3)
            r.raise_for_status()
        except Exception as err:
            print("Exception Error:", err)
            return 0.0
    else:
        return 0.0

    return r.json()[id]['usd']


def main():
    eth_price = get_price('ethereum')
    bat_price = get_price('basic-attention-token')
    lrc_price = get_price('loopring')

    eth_amount = 0.0
    bat_amout = 0.0
    lrc_amount = 0.0
    days = []
    eth_data = []
    bat_data = []
    lrc_data = []
    total_data = []

    for key in tipping_data:
        eth_amount = f"{sum(tipping_data[key]['eth']) * eth_price:.3f}"
        bat_amout = f"{sum(tipping_data[key]['bat']) * bat_price:.3f}"
        lrc_amount = f"{sum(tipping_data[key]['lrc']) * lrc_price:.3f}"

        days.append('Data ' + key)
        eth_data.append(eth_amount)
        bat_data.append(bat_amout)
        lrc_data.append(lrc_amount)
        tip_total = float(eth_amount) + float(bat_amout) + float(lrc_amount)
        total_data.append(tip_total)

    avg_total = f"${statistics.mean(total_data):.3f}"
    print(avg_total)

    eth_data = list(map(float, eth_data))
    avg_eth = f"${statistics.mean(eth_data):.3f}"
    print('AVG_ETH: ' + avg_eth)

    bat_data = list(map(float, bat_data))
    avg_bat = f"${statistics.mean(bat_data):.3f}"
    print('AVG_BAT: ' + avg_bat)

    lrc_data = list(map(float, lrc_data))
    avg_lrc = f"${statistics.mean(lrc_data):.3f}"
    print('AVG_LRC: ' + avg_lrc)

    # Daily tipping bar chart
    fig = go.Figure(data=[
        go.Bar(name='BAT', x=days, y=bat_data),
        go.Bar(name='ETH', x=days, y=eth_data),
        go.Bar(name='LRC', x=days, y=lrc_data)],
        layout_title_text=f"""
        Publish0x Tip 50% Author 50% Me Earning Avg: {avg_total}
        """
    )
    fig.update_traces(texttemplate='%{y:.3f}', textposition='outside')

    fig.add_trace(
        go.Scatter(
            name='Tip Total',
            x=days,
            y=total_data
        )
    )

    # Change the bar mode
    fig.update_layout(
        # barmode='stack',
        xaxis_title="Tip Data",
        yaxis_title="$ Amount",
        legend_title="Crypto Tips",
    )
    # fig.write_html('chart-20-80.html', auto_open=True)
    fig.write_html('chart-50-50.html', auto_open=True)
    fig.show()


if __name__ == '__main__':
    main()
Get Rewarded For Browsing! Are you Brave?


➡️ Website