As a quant trader, data is the life-blood of my strategies. Data allows each of my trading bots to form their own unique opinions about their environments in much the same way our own experiences shape our view of the world.
One of the things I love about trading cryptocurrencies in particularly is the democratic access to data; exchanges make it very easy to access their data, especially via computer programs.
This stands in stark contrast to the traditional financial markets, like the US stock market or futures markets, where you have to pay out the ass to get access to any sort of market data. They even make you pay for delayed data, in certain situations. Its a fucking racket.
Why is this so in traditional markets?
Well, its obvious why the exchanges love it because you've got to pay them to play the game.
The market participants, who pay the market data toll, tolerate this arrangement because they know it keeps out the little guys and is thus a barrier to entry and new competition...
But in crypto things are different. Almost every exchange of any size has something called an API which we can all use to get the data we need for free
Today we're gonna look at how to download historical data from Binance using the Python programming language. I picked Python because:
- of its ubiquitous use in the financial industry (better know Python or R for data analysis)
- the amount of work other people have already done building useful packages
- i know it very well (not gonna bullshit you! LOL)
In particular I used Python 3.6 for this tutorial. This assumed you already have Python installed, there are plenty of tutorials online but i would recommend just going to https://www.python.org/ and going to their downloads section.
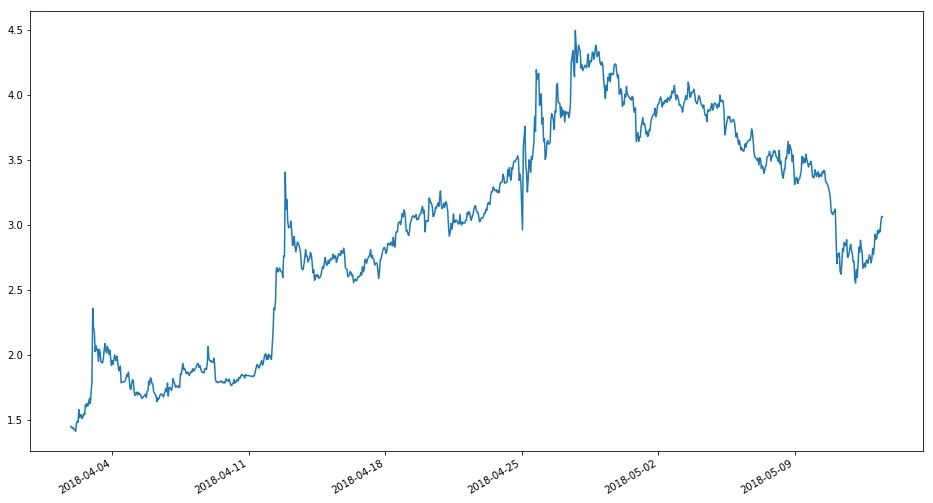
The structure of this tutorial will begin by going over the packages we need to import to accomplish our task. Then we'll build a function to download any symbol's historical data. Then we'll use the function to visualize the price of STEEM/USDT over the last month.
First we're gonna import the packages we need:
import requests        # for making http requests to binance
import json            # for parsing what binance sends back to us
import pandas as pd    # for storing and manipulating the data we get back
import numpy as np     # numerical python, i usually need this somewhere
                       # and so i import by habit nowadays

import matplotlib.pyplot as plt # for charts and such

import datetime as dt  # for dealing with times
If you don't have these installed already you can always use pip to download them without much fuss.
A web API like Binance's is really just a specially crafted url which instead of returning a human readable webpage, returns a machine readable chunk of data instead.
For instance, on the Binance API everytime we want to get the historical price bars for a symbol, we use this root url:
root_url = 'https://api.binance.com/api/v1/klines'
Then to get the bars for a specific symbol and timeframe, we craft a special url to get the data we want:
symbol = 'STEEMETH'

interval = '1h'

url = root_url + '?symbol=' + symbol + '&interval=' + interval
print(url)
This will print the url:
https://api.binance.com/api/v1/klines?symbol=STEEMETH&interval=1h
You can click on that link and see the data that is returned. Its a bunch of numbers and brackets. Really its price data and its defined in a format called JSON. Really JSON is just a multi-level dictionary.
You dont really need to know the low level shit, because we're going to use the built-in Python package json to parse everything for us like magic:
data = json.loads(requests.get(url).text)
This is one of the reasons i love Python, easy one liners like this. In this one line we make a HTTP GET request to Binance's API to grab the raw bars data, then we use the json package to parse that into a Python dictionary. Phew!
Now we're going to take that dictionary and turn it into something VERY USEFUL called a dataframe
We do this with an open source Python package named pandas
Despite the cute name, it was originally developed by AQR, a huge quant hedge fund
df = pd.DataFrame(data)
df.columns = ['open_time',
              'o', 'h', 'l', 'c', 'v',
              'close_time', 'qav', 'num_trades',
              'taker_base_vol', 'taker_quote_vol', 'ignore']

df.index = [dt.datetime.fromtimestamp(x/1000.0) for x in df.close_time]
These lines convert the dictionary into a dataframe. We also properly label the columns according to Binance's API docs and then we convert the raw millisecond timestamps into python datetime objects.
The dataframe will allow us to perform analysis and do data manipulation if we so chose...
Now let's wrap this all up in a convenient function we can use to download the data for whatever symbol our hearts desire:
def get_bars(symbol, interval = '1h'):
   url = root_url + '?symbol=' + symbol + '&interval=' + interval
   data = json.loads(requests.get(url).text)
   df = pd.DataFrame(data)
   df.columns = ['open_time',
                 'o', 'h', 'l', 'c', 'v',
                 'close_time', 'qav', 'num_trades',
                 'taker_base_vol', 'taker_quote_vol', 'ignore']
   df.index = [dt.datetime.fromtimestamp(x/1000.0) for x in df.close_time]
   return df
Now we can do cool stuff like download the data for STEEM/ETH and ETH/USDT:
steemeth = get_bars('STEEMETH')
ethusdt = get_bars('ETHUSDT')
Now we can multiply the price of STEEM/ETH by ETH/USDT to get STEEM/USDT
steemusdt = steemeth['c'].astype('float') * ethusdt['c'].astype('float')
And plot the result:
steemusdt.plot()
Now with the get_bars function you can download data for whatever symbols Binance supports. You can also change the interval parameter, which is set to '1h' or 1 hour by default.
So just to put the whole thing together:
import requests        # for making http requests to binance
import json            # for parsing what binance sends back to us
import pandas as pd    # for storing and manipulating the data we get back
import numpy as np     # numerical python, i usually need this somewhere
                       # and so i import by habit nowadays

import matplotlib.pyplot as plt # for charts and such

import datetime as dt  # for dealing with times

def get_bars(symbol, interval = '1h'):
   root_url = 'https://api.binance.com/api/v1/klines'
   url = root_url + '?symbol=' + symbol + '&interval=' + interval
   data = json.loads(requests.get(url).text)
   df = pd.DataFrame(data)
   df.columns = ['open_time',
                 'o', 'h', 'l', 'c', 'v',
                 'close_time', 'qav', 'num_trades',
                 'taker_base_vol', 'taker_quote_vol', 'ignore']
   df.index = [dt.datetime.fromtimestamp(x/1000.0) for x in df.close_time]
   return df

steemeth = get_bars('STEEMETH')
ethusdt = get_bars('ETHUSDT')
steemusdt = steemeth['c'].astype('float') * ethusdt['c'].astype('float')

steemusdt.plot(figsize=(16,9))
This is obviously just the start of the usefulness of this function. Subsequent tutorials will make use of the Binance API to get historical data for more advanced analysis like correlation filtering and network analysis. Check back for more quant finance and trading tutorials in the future!