What happened since my last analysis?
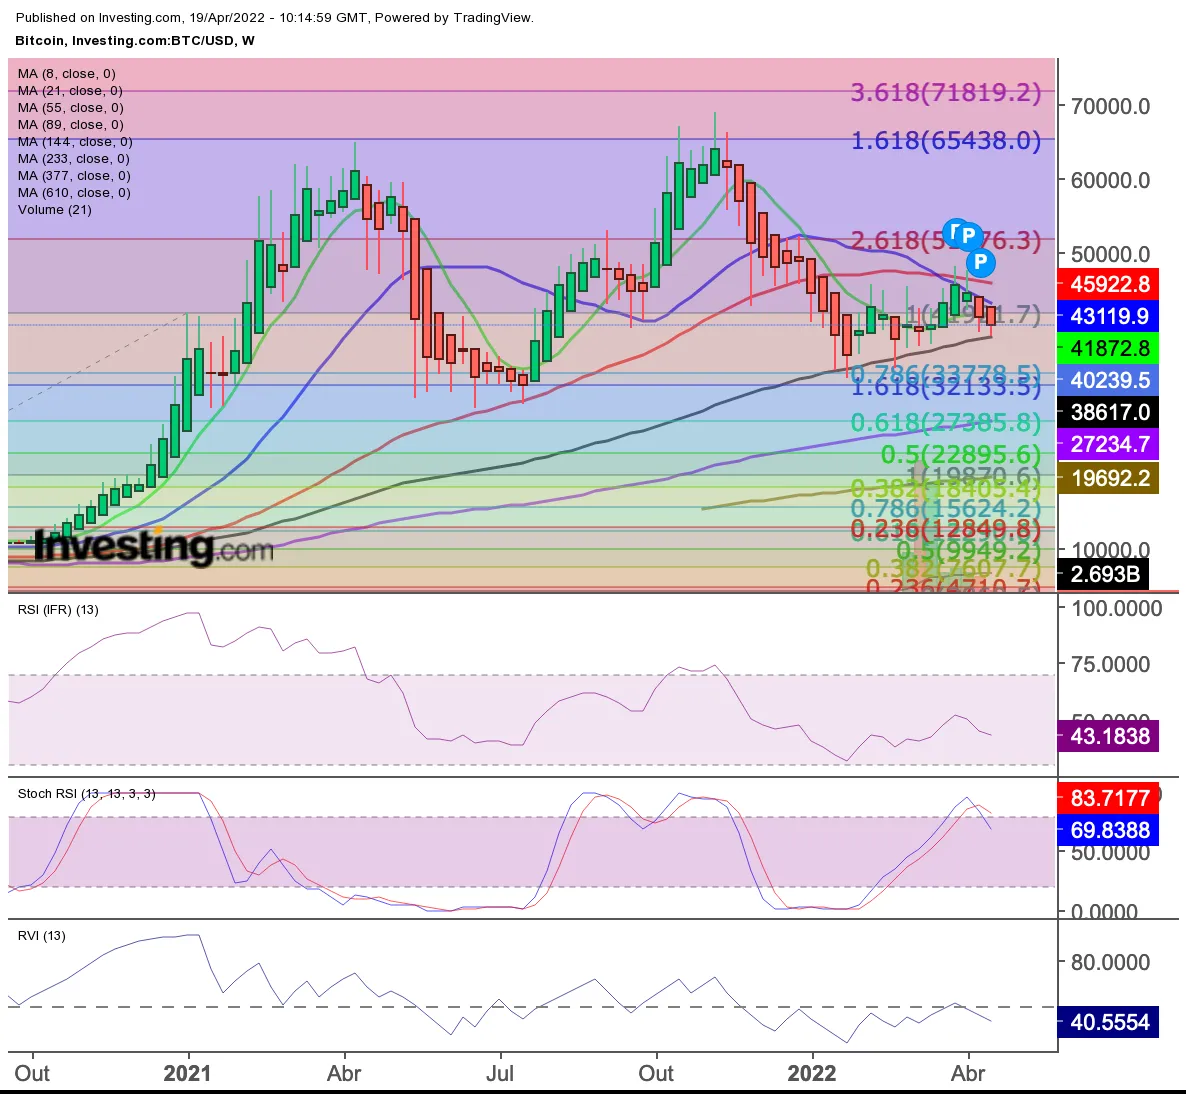
One month ago, I posted my technical analysis of bitcoin. My set up is based on a Heiken Ashi (modified candlestick) chart, an array of simple moving averages, which I combine with Fibonacci retracement and momentum indicators (relative strength index, stochastic oscillator, and relative volatility index). Here's the updated chart:
Back then, I interpreted that...
...the selling movement is exhausting itself and we may see a reversal soon (less than one month). Volume has increased in the past couple of weeks, and there seems to be buyers at around USD 33k that won't let the price drop further. Yet, there are contradictory trends to this reading, like the 21MM crossing the 55MM downwards, but the technical indicators do point to a reversion, too. Finally, the past three weeks were doji stars in the Heiken Ashi chart, which tend to signal bottom of trends. If prices break the USD 42k level, they will first test the 21MM and 55MM which are at around USD 47k, but the target is the USD 52k level.
What happened in the coming weeks with close to this prediction: Bitcoin went through a short-lived (three-week) bull run, reaching $48,199 in the w/c on March 28. It therefore over-shot the first ($47k) target, which was around the level of the 55-week moving average, but failed to go further to test the $52k level, going down two weeks in a row. In my view, this was a healthy consolidation, and we will see bitcoin going up again in the coming weeks.
What's my take for the coming weeks?
Yesterday it hit $38k, the level of the 89-week moving average (indeed, this was the level that on April 11 I told a friend it would go - see below screen grab of WhatsApp chat, which I translate into English in the caption). Yesterday's daily candlestick was an "engulfing bullish" pattern, indicating short-run trend reversal.

In my view, in the coming 2-3 weeks we will see bitcoin moving upwards to $46k, which is the 55-week moving average level. Further indicators that we would see a move upwards are the momentum oscillators levels: while the stochastic went into over-bought zone on a weekly basis, the relative strength index (which is less volatile) is still below 50 and showing "higher lows" when there is trend reversal. The relative volatility index should move into bullish zone this week or next. Yet, it must consistently (i.e. with volume) overcome the $46k level if we are to see bitcoin at the fifties again: I would like to see it closing next week at $48k or above to confirm a solid bullish trend. The support level bitcoin cannot lose right now is $38k, so pay attention to this level.
What could go wrong?
Again, the fundamentals always matter. Given the correlation between bitcoin and the US stock market (in the short run), factors that affect the latter may also impair the former, such as: 1Q corporate earnings, US and global economic outlook, especially inflation vs. growth prospects, and the unfolding of the Ukraine war. Still, I believe the S&P500 will climb to 4,500 points, a level it must overcome to exit a downward channel it is in.