

Hey team,
Remember, my trading strategy waits for price to pull back to daily support/resistance zones so we can more safely manage our risk.
After Ethereum broke through its 2018 resistance zone, the bulls' strength has meant that I haven't had a chance to safely trade.
Until today!
Take a look at the Ethereum daily chart that I FINALLY get another chance to talk about below.
ETH/USD Daily:
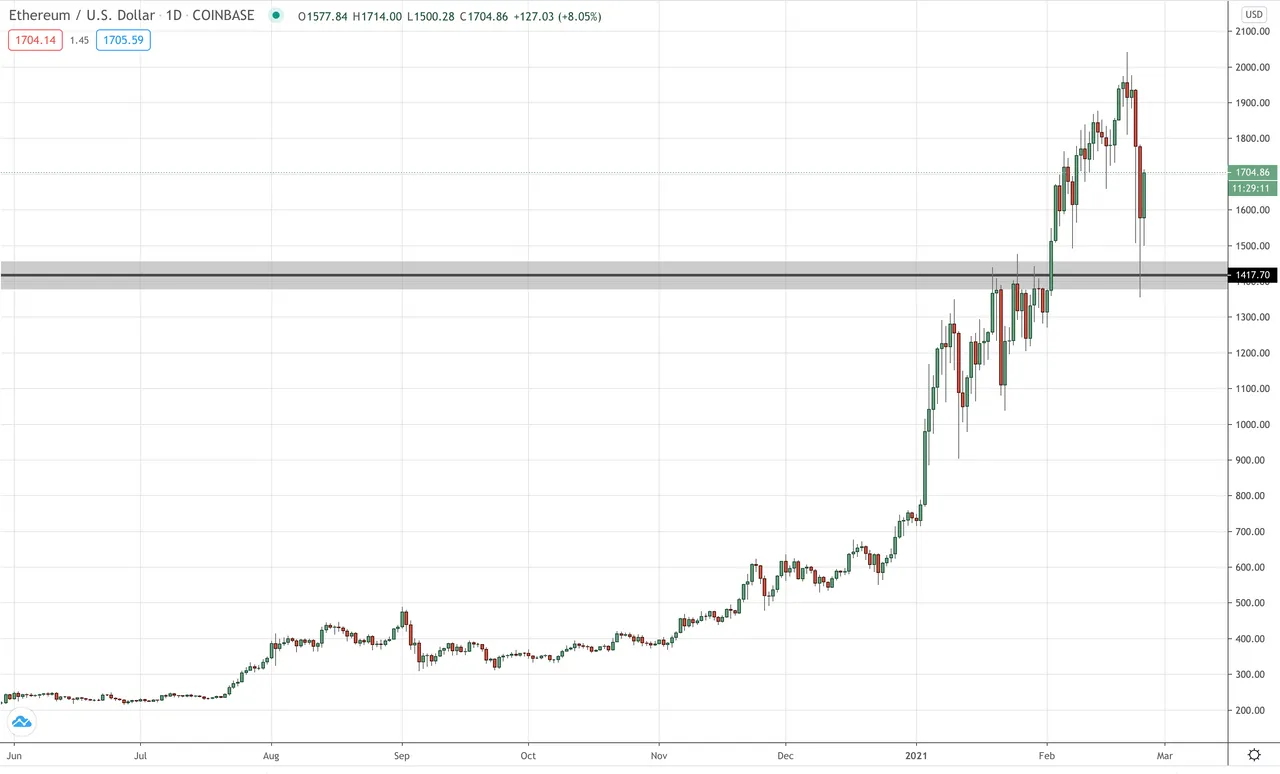
There's only one zone on that chart that matters and it's the 2018 swing high zone.
We've been talking about this one on the blog for ages so it should already be on your chart.
If not, just click the link a couple of paragraphs higher and follow the narrative all the way back.
As for the why I'm excited to be talking about Ethereum again, well take a look at where the drop bounced.
Yep.
EXACTLY on the previous resistance zone that when retested, turned to support.
As always, even when you think the arse is falling out of markets and they're trading irrationally...
...They're almost always in fact trading very rationally and orderly.
Today's Ethereum price action is just another example.
Best of probabilities to you,
Dane.
FOREX BROKR | LeoFinance Blog
Daily market analysis.