The Hive blockchains has around 2.4M. There has been a big expansion in the number of accounts in the last year, 2021, while 2022 has some moderate numbers.
What percent of these accounts are active? How many active accounts the Hive blockchain has and how are they transacting/using on the blockchain?
How is the bear market influencing the number of active accounts?
Let’s take a look!

Top Four Hive Operations
We will be looking at the activity on the chain by the top operations made:
- Post and comment
- Vote/Curate
- Transfer coins
- Custom JSON transactions
Apart from the above, reading, or page views, is also a crucial part of this ecosystem, but this type of operation is not stored on the blockchain. There are some general traffic websites that can be used for this, like https://hypestat.com/.
We will be looking at the number of active accounts by the operations stated above for 2022.
We will be looking at the number of DAUs (daily active users) and the number of MAUs (monthly active users).
Number of Accounts That Posted or Commented
First let’s take a look at the number of accounts that are posting on the blockchain, as one of the core operations.
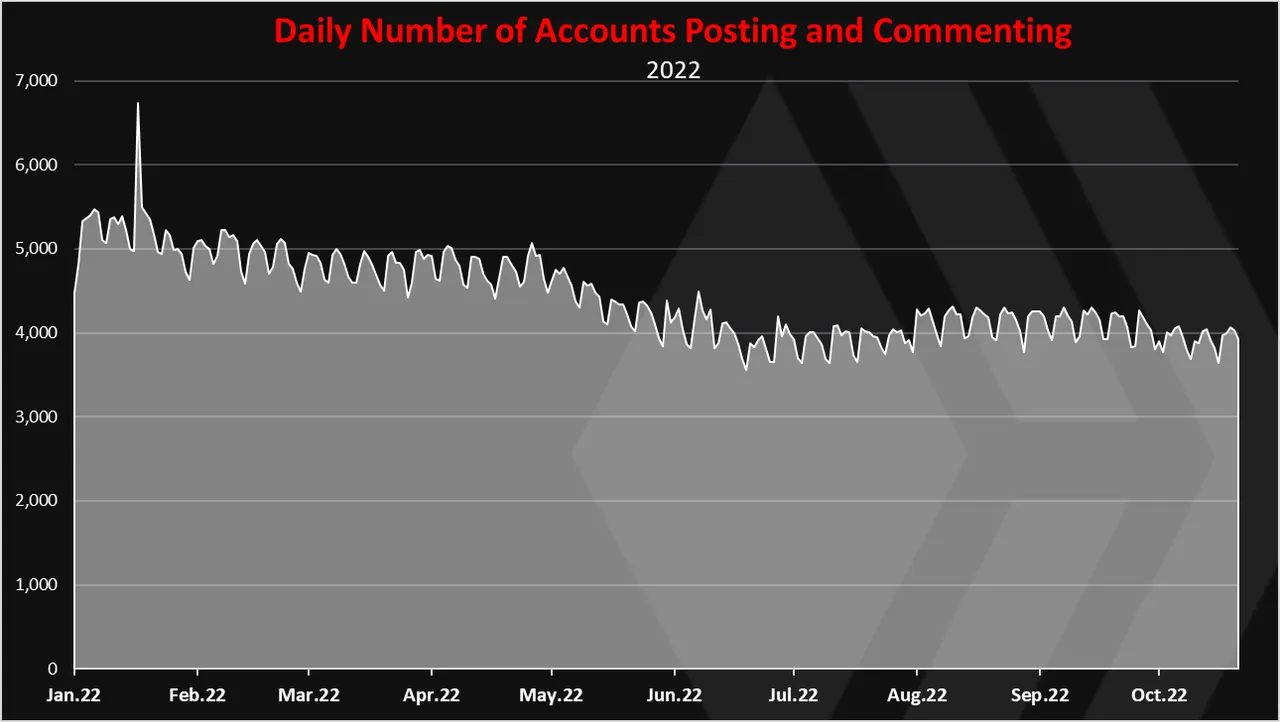
The above is the chart for DAUs, for accounts making posts or comments on the blockchain.
We can notice a slow downtrend in the numbers of accounts posting and commenting in 2022. The trend seems to stopped around June 2022, and since then we have almost flat numbers of accounts making post and comments. Just around 4k accounts per day. At the start of the year there was around 5k accounts per day.
We can say that the drop in the number of accounts making post and comments has small compared to the drop in the prices.
On a monthly basis the chart looks like this.
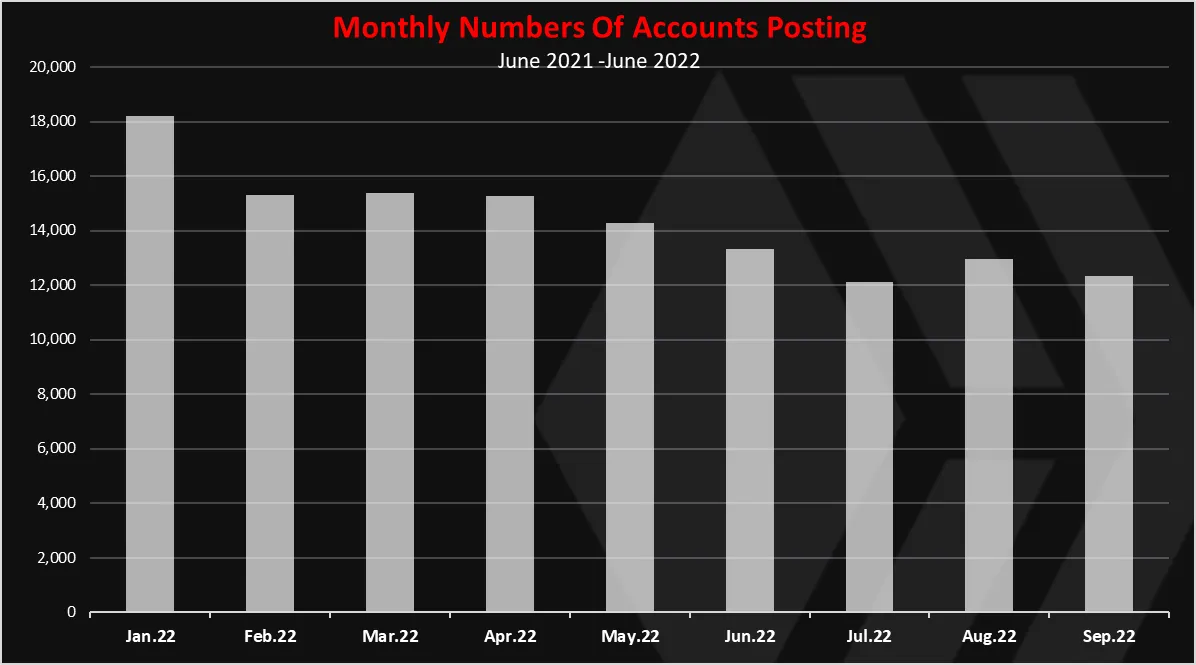
We can see the overall trend here as well with a peak in January with 18k accounts posting or commenting per month, a drop until June and now we are around 12k active accounts per month.
The monthly data for accounts posting or commenting MAU’s is probably the better indicator then the daily one DAU’s, since not everyone is making a daily activity on chain.
Number of Account that Vote/Curate
How about then number of accounts that vote. What is their number? After all the voting feature on the blockchain is at its core. Rewards are distributed via votes.
Here is the chart.
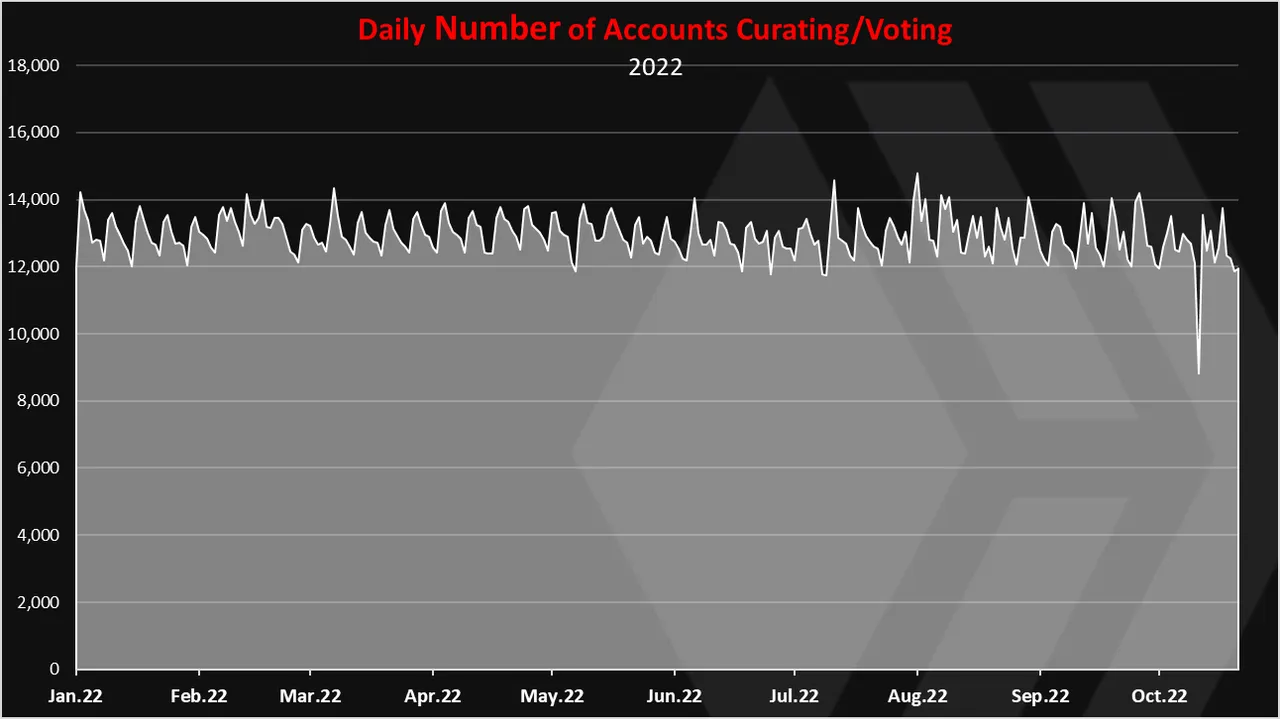
In the period the number of accounts voting/curating has been between 12k to 14k per day, and it has been very constant.
Whats interesting is we can notice the temporary drop in October during the HF, when the hive.vote service didnt worked, the numbers dropped to 9k per day.
The *monthly chart for accounts voting/curating looks like this.
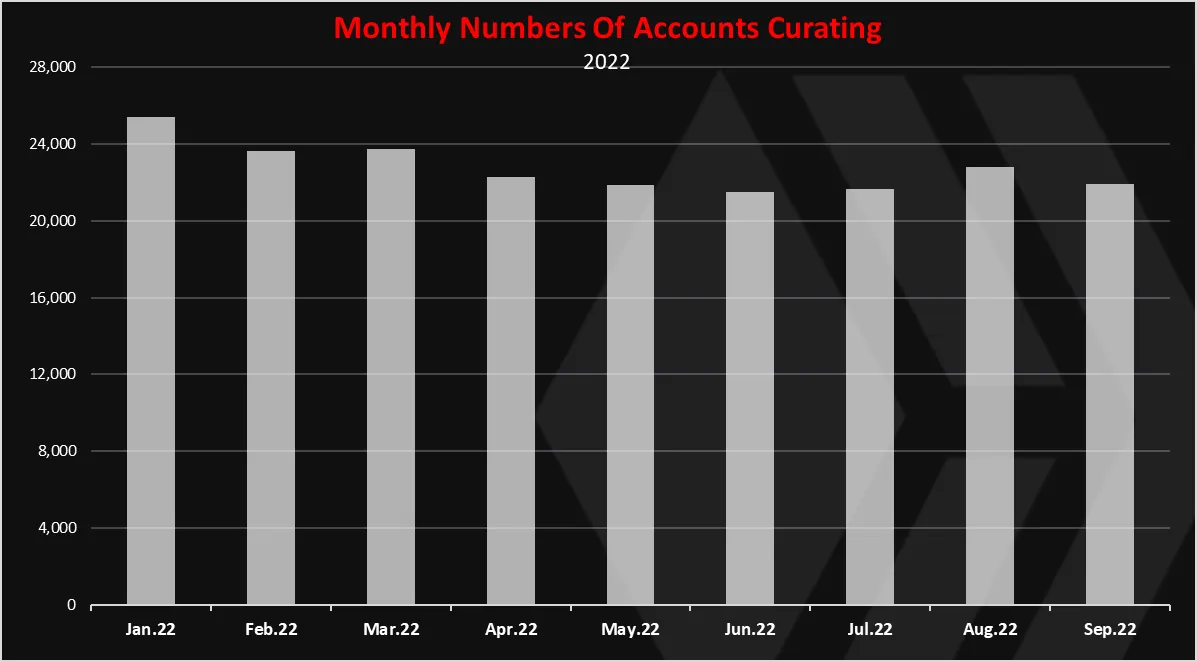
A peak in January 2022, with 25k MAUs, and then a slight drop to a 22k MAUs where we are now.
Compared to the number of posting accounts, a 12k in September, the number of accounts curating is bigger with a 22k now.
Number of Accounts That Are Making Transfers
What about the basic crypto activity? Transferring value. How many users are making daily transactions? Here is the chart.
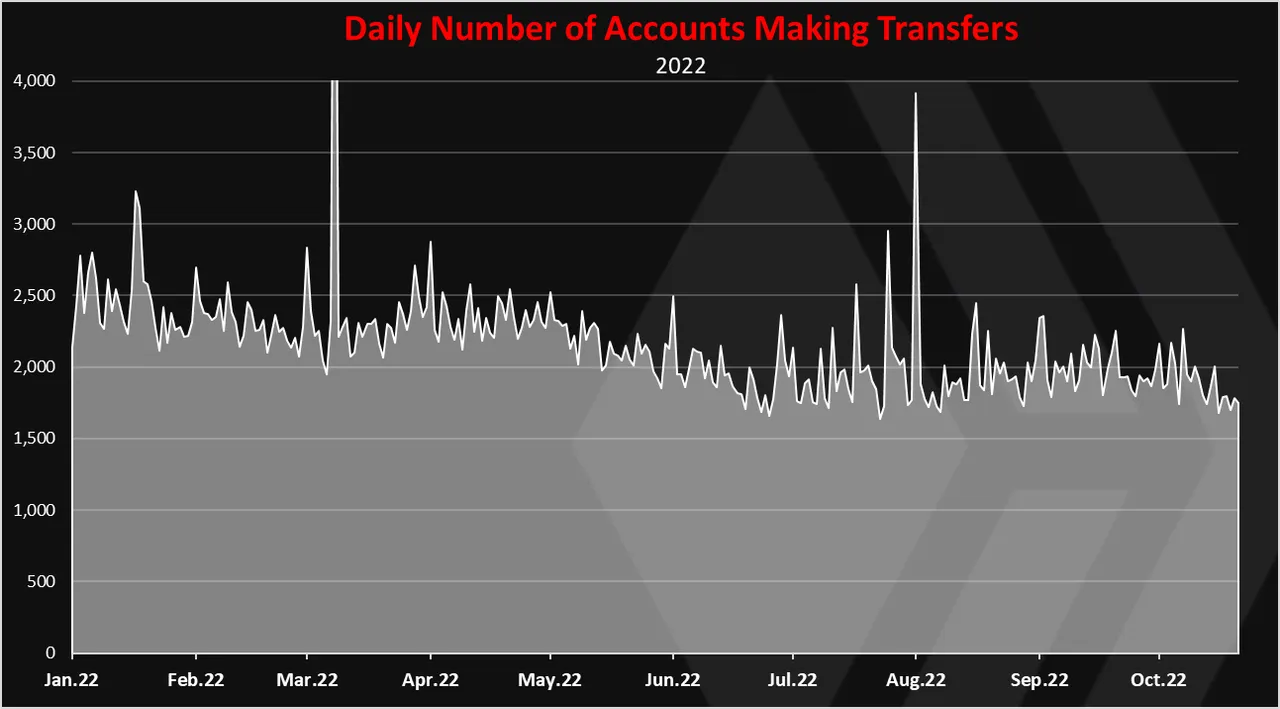
A similar trend here as for the posts. A slow drop from 2.5k accounts per day making transfers at the beginning of the year to around 2k now.
The monthly chart looks like this.
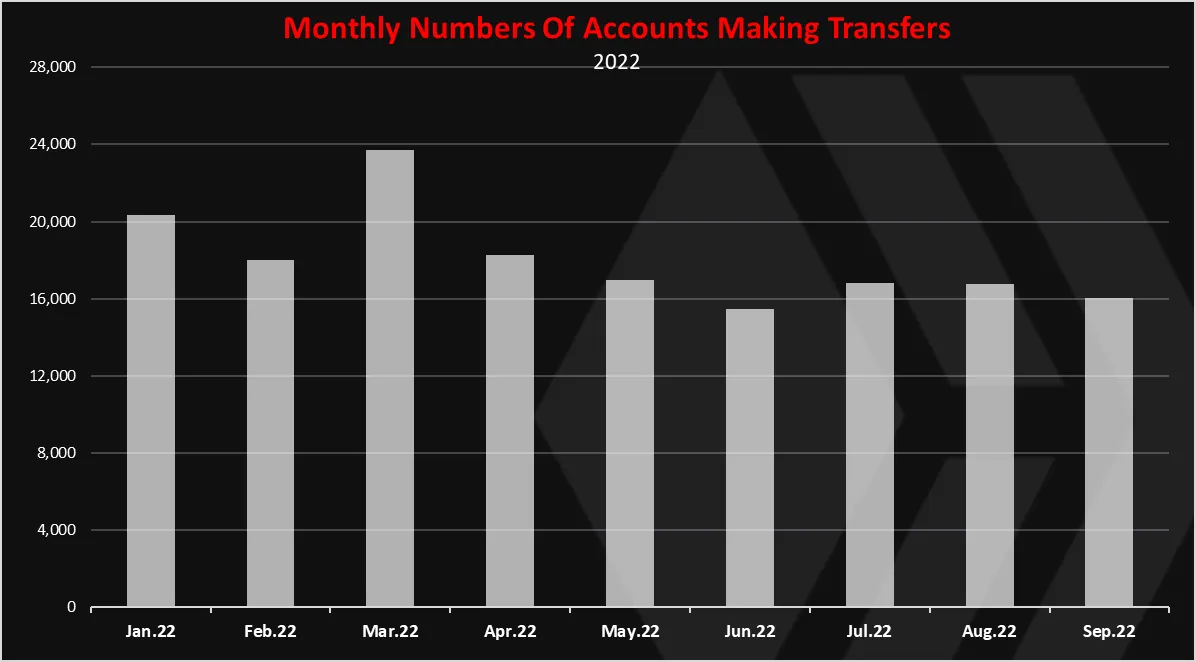
More fluctuations on the monthly chart. March has been the record high for 2022 with 24k accounts per month making transfers. A steady number since then with around 16k accounts per month.
What’s interesting about the accounts making trasfers is that the ratio of MAUs to DAUs is quite high or around 10 to 1.
Number of Accounts That Are Making Custom JSON Operations
Now let’s take a look at the dominant operation. The custom json transactions!
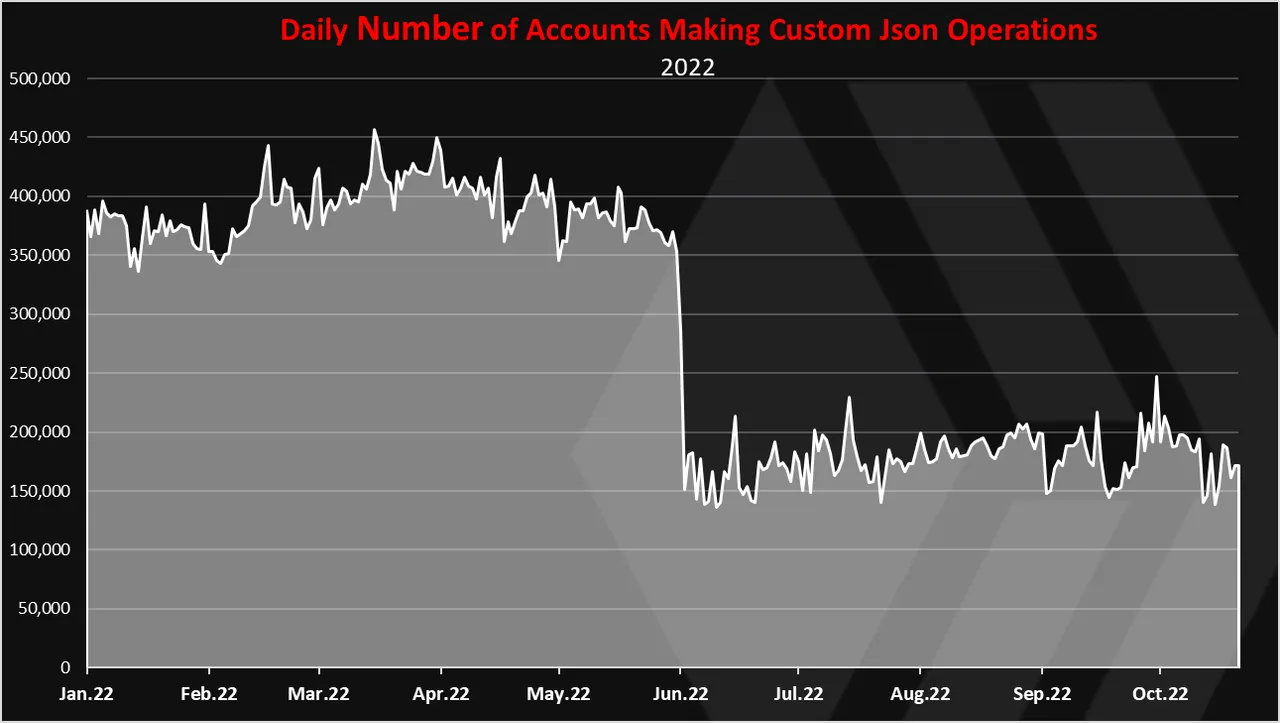
This is an interesting chart!
We can notice the sharp drop in June 2022 from around 400k to just bellow 200k. Half od the accounts stopped being active.
Splinterlands is behind most of the activity of these accounts, and the change in the numbers is because of a change in the reward system in June that make half of the accounts to stop playing. These have most likely been bots that were playing in the low leagues.
On a monthly basis the chart looks like this.
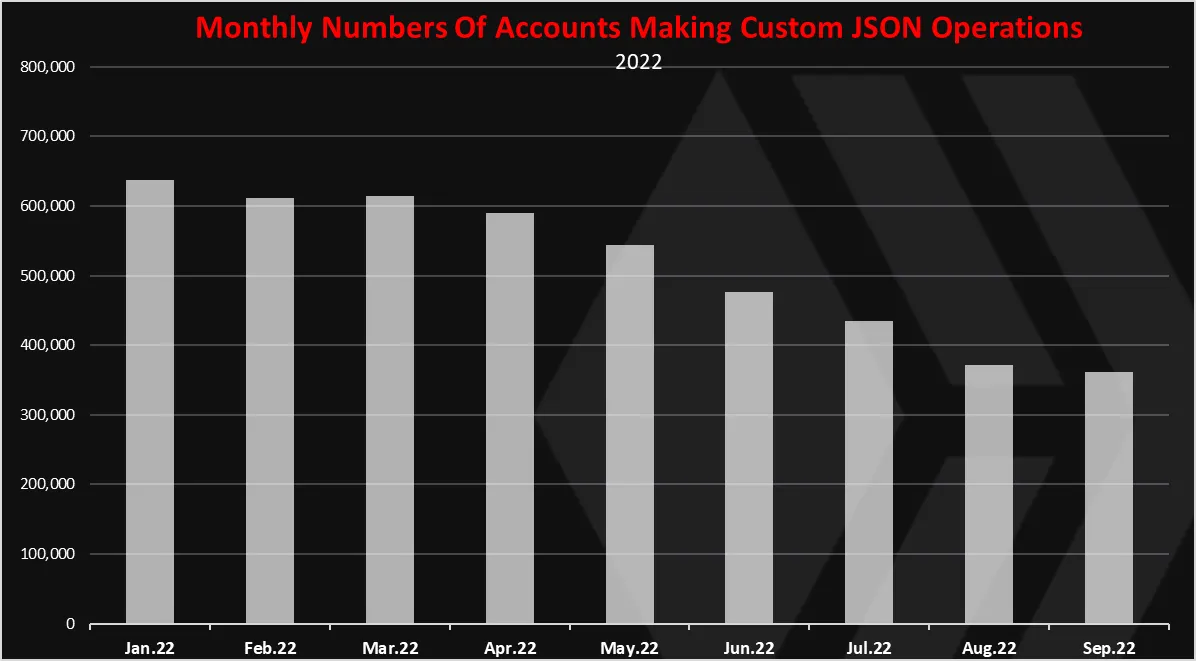
We can notice the drop in the numbers of monthly active accounts for json operations here as well, but unlike the DAUs chart there is no sharp drop in the numbers after June.
A steadier transition in the numbers here. At the start of the year there was more than 600k accounts and now we are around 360k MAUs for Splinterlands.
Monthly Active Accounts By Type Of Operation
What about monthly active accounts? Not everyone is making daily activities. Monthly active accounts can be a more accurate representation. Here is the chart for MAUs by category.
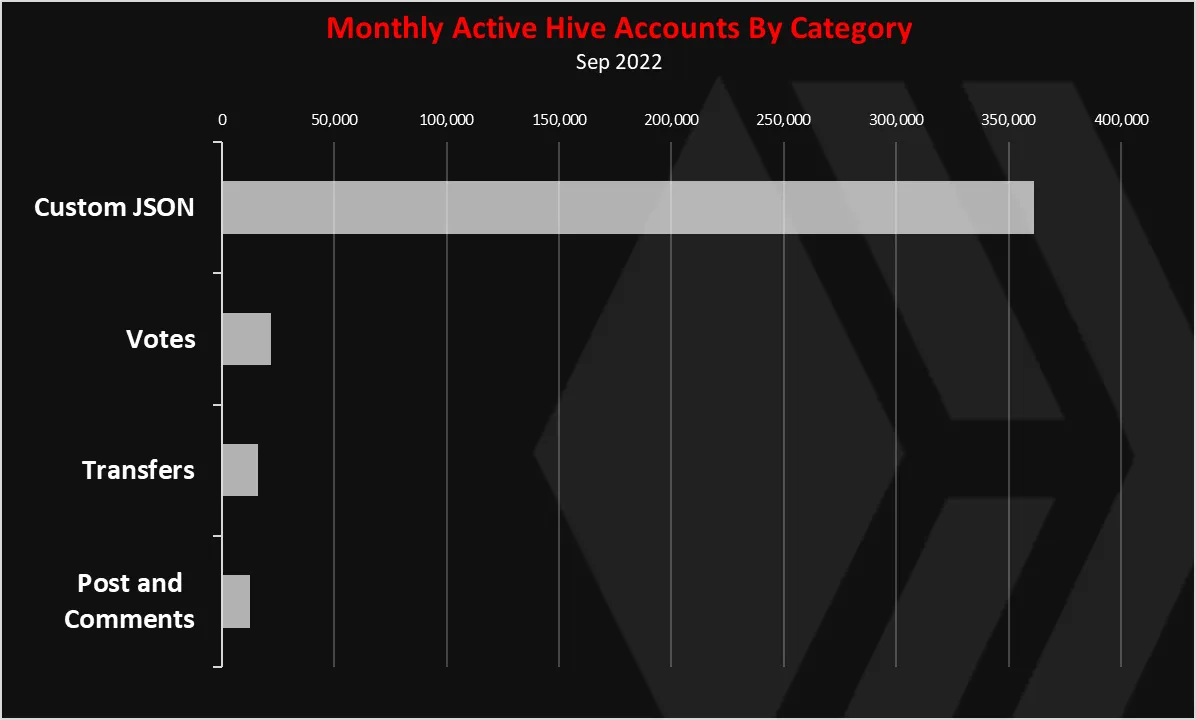
A domination of the custom json operation that are coming from Splinterlands.
A 360k accounts making custom json operations, 22k accounts curating, 16k making transfers and 12k accounts posting or commenting per month!
2022 has been a year with a bad market conditions, but we can see that the drop in the active accounts on Hive in the various categories has not been as drastic as the drop in price. There is obviously a key group around here that is sticking around in any market conditions.
The biggest drop has been in the active accounts making custom json operations (Splinterlands). This is the category with the highest number of active accounts as well. Most of the drop has been because of the Splinterlands team has introduced some changes that are not in favor of bots, that have stopped playing.
At the end to add that not all the transactions above have the same weight. Its easier to curate, click the like button than making a post. Also, json operation can be easily made, and in lot of the cases automated. Making posts and comments require a bit more human effort.
All the best
@dalz