
A primary reason why President Trump won a resounding electoral victory in 2016 was his tough stance on illegal immigration. While the U.S. has historically welcomed outsiders, the dramatic rise in migrant crime – particularly in Europe – has gradually deteriorated support.
Perhaps sensing this undertone, the mainstream media has quickly and frequently distributed articles blasting the link between immigration and crime. A key example is The New York Times report, “The Myth of the Criminal Immigrant.” In it, author Anna Flagg argues that the fear tactic surrounding migrant crime is essentially “fake news.”
But is it really? At first, the statistics appear favorable for the liberal, free-for-all thesis. Flagg starts off her argument with two charts: one depicting 118% growth in the immigrant population since 1980, and another showing a 36% decrease in violent crime over the same time frame.
She then juxtaposes the 109% increase in immigration in urban areas since 1980 with specific crime categories. One by one, Flagg produces charts demonstrating that assaults, robberies, and murders are all down double-digits over the specified timeframe.
To the uninitiated, the statistics seem compelling. However, clever folks repeatedly twist stats to distort reality. In this case, nothing that Flagg produces proves that migrant crime isn’t a problem. Crime rates are declining because fewer native-born Americans are committing them. After all, the native-born category still dominates all demographic delineations.
And as it turns out, Flagg leaves out additional crucial data that’s particularly damning for migrant crime.
Shocking Picture of Illegal Migrant Crime
The Cato Institute is one of the few mainstream organizations that break down migrant crime based on race or ethnicity. Although they maintain the status quo – that migrant crime is largely a myth – their data exposes an ugly reality.
In fairness, Flagg and the mainstream are correct: immigrants’ crime rates per 100,000 residents is far lower than their native-born counterparts. Legal migrant crime averages 20.5% across all races and ethnicities. Even illegal migrant crime averages nearly 38% against their respective native-born categorizations.
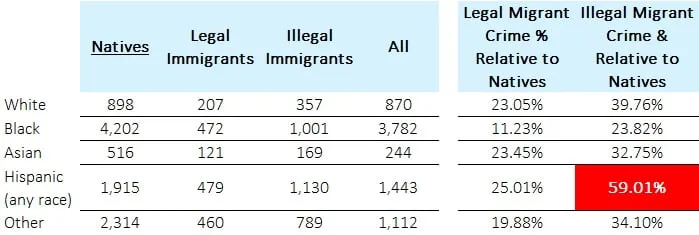
But why the big jump between 20.5% to 38%? While all categories of illegal migrant crime increases relative to legal immigrants – we would of course expect this – Hispanic illegals commit the lion’s share of crimes. In fact, Hispanic illegals are the only illegal demographic whose crime rate exceeds 50% of native-born Hispanics (at 59%).
Now mainstream institutions will regard this information as racist. I’m sorry, folks, but facts are not racist. When Trump made his accusations that Central America was not sending their best people to the border, he was right.
Every other race of illegal immigrants featured crime rates relative to native-born counterparts below 40%. White illegals ranked highest at 39.8%, Asians settled in the middle at nearly 33%, and Blacks hit the lowest rate at just under 24%.
We can dive into the granularity for each category at some other point. But suffice to say, we need the wall at our southern border because that’s where the most violent migrants originate. That’s not emotion talking: these are the plain facts.

Original Article Available HERE