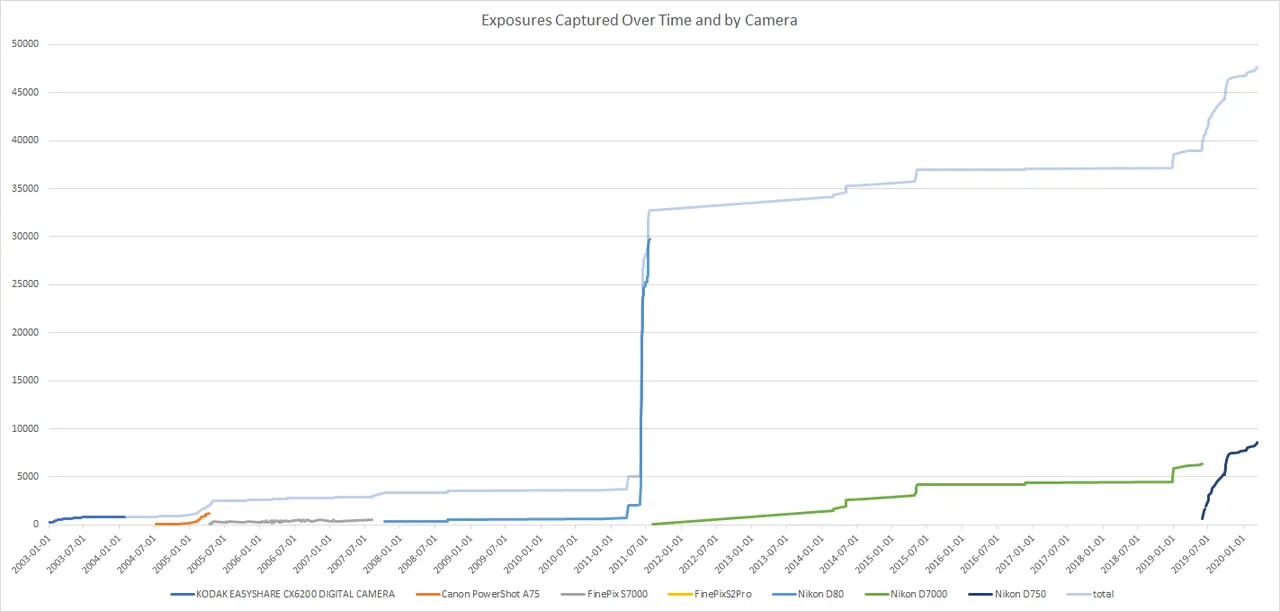
This graph is explained by the text that follows
Portrait photography is my favourite. With the current state of affairs, a pandemic, mandatory social distancing, national parks closed, and gatherings of any number off the cards, I'm missing my camera, and don't see myself as a particularly compelling subject for self portraits, no matter how much people covet my mighty beard.
My day job is incredibly busy at the moment, to the point where some of the analytics and reporting that I need to do on a regular basis ... breaks Microsoft Excel, owing to the fact that my work laptop only has 8GB of RAM.
I've taken to learning KNIME, an open source analytics program that is more data-science than Excel.
In order for me to become competent in this piece of software, I want to analyse some non-work related data.
I've taken a lot of photographs in my life, and ever since my very first digital camera, I've kept a catalogue of every image I've ever taken. I don't, however, have this in a database. Thus begins my learning journey into how I can gain insights and knowledge about my photographic history through data.
Every digital photograph you capture contains something called EXIF data. EXIF stands for Exchangeable Image File. Information about photographic variables such as Shutter Speed, ISO, Aperture, Lens Type, Focal Length, etc is stored in the EXIF data of a digital image.
The first step is obtaining the data from every single photograph I've ever taken.
After some googling, I settled on using EXIFTool. It has command line options to extract your EXIF data and send them to a CSV.
After extracting the file, and placing it into my C:\WINDOWS directory, I can run a command via Windows Powershell.
C:\Users\WhoEverYouAre> exiftool -a -r -csv X:\Photos\ >out.csv
The first part
exiftool
Instructs windows to run the exiftool application, and the following arguments tell it what to extract, where from, and how.
-a
ALL the Data. And I mean, ALL the data. I tested on a Sample File from a Nikon D80, shot back many, many years ago, and there were approximately 400 columns worth of data. This ranged from the time the image was shot, focal length, focus point used, and all sorts of other strange things like what every camera setting was used, down to if there was a battery grip attached.
-r
Recursion. Look inside every directory inside the directory specified. I lay out my photos into individual folders per shoot or event, which means, I point at where my photos live on my storage, and let it rip.
-csv
Ensure the output is in a CSV format.
X:\Photos\
The directory the images will be scanned from.
>out.csv
Output it as a CSV.
After quite some time, here's the result:
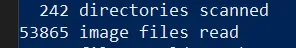
This resulted in a CSV file of around ~350MB. Opening this in Excel, and attempting to build a pivot... isn't a good time at all...
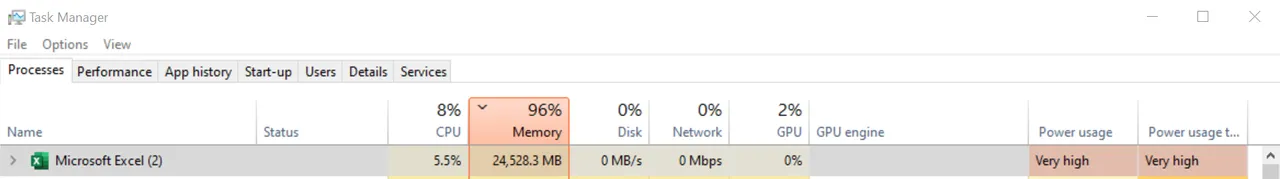
There's a few problems with this screenshot. The data I extracted was ALL the data, and wasn't very clean. There was some camera raw data, some lightroom data, some adobe camera raw data. Not all images had this data, and not all of it was useful.
I deleted a number of columns that contained data I wasn't interested in. The CSV was still around 75MB, much more manageable, but still too much for Excel.
This is why I need something with more grunt, and something that can do a better job of analytics. Something more efficient. Enter KNIME.
There’s some simple insights I can draw out of this data by pivoting and grouping data. The first interesting piece of data that I am interested in, and is the main subject of the remainder of this post is about what cameras have I used, and when, and by extension… why did I take more photographs in some moments in time versus other points in history?
Some fun facts about the underlying data:
- I’ve stored every photo I’ve taken on a digital camera and managed to retain this
- Not every photo was a “keeper” in the early days, and the total number of photos or shutter actuations on cameras are likely higher than the data presented
o This is especially true for my early cameras which did not have “shutters” as such, as they were not DSLRs, or products that counted this in the EXIF data - It has been scrubbed to ensure that there is only one unique file name per directory, so the period of time when I shot raw and jpeg (as opposed to me now shooting just raw) to remove duplication.
For more information about the cameras I’ve owned, and the history of my journey through photography, I wrote about this in the past, and I expect to go back into this information more and more as time goes on.
So, how has my camera usage piled up over time?
Well, it’s a rather long story, as you can see…
There's a gradual ramp as I discovered photography, and got to play with my first digital camera as a young kid - a hobby that generally was limited to a number of factors - when I had access to batteries, and when we left the home. This was generally on weekends, and my first subjects were generally those found within a graveyard, as we went to visit my grandmother's grave each and every weekend.
Then, there was a bit of a gap while I saved up for a new camera, school got "busy", and photography fell to the wayside as I focused on other passions in my life - like gaming.
When I got my next camera, the ramp was much steeper, I was enjoying photography, doing more of it at high school, and was preparing to move into university. This camera had a very short lifespan, as I quickly upgraded to a "bridge" camera as I entered my first year of university.
Then, at some point, I got my first DSLR. I used it for university, but at the time, I was also shooting black and white film, which did not make it onto this chart - as none of the film scans I completed are represented in the data below.
Then, we see a massive uptick in the number of exposures, which coincide with two things - first, the arrival of my D80 (and its lenses) reinvigorated my love for photography. My university studies also accelerated at an alarming rate, with lots of long exposures, and my first experimentations into portraiture.
Then, it didn't stop. In fact, the line went parabolic, something we may be familiar with graphs that may be visible in the media recently...
This spike in photographs was due to the fact that I travelled through Europe, and then straight into the US. Then, I upgraded to a D7000, where you can see a steady ramp back up to using the camera on a regular basis.
Last year, around this time, I started toying with the idea of upgrading cameras, and I did, as you can see the sudden increase again at the end of the line where I started using the Nikon D750.
I am currently planning to do some more photographic work in the near future, as the lockdown eases here in South Australia, but I want to continue to use this data to help inform my photographic practice, and to take these nostalgic journeys back through my photographic history.
For the next post in this analytical history, I will look at presenting my history of exposure modes - when did I stop using auto? What other modes did I use on my camera? When did I start to use flash more often? What aperture did I use in which months?
This data set has a mountain of information that I can mine through, and I'm looking forward to seeing what I might be able to learn and discover about my personal photographic practice.
Learning analytical skills on large datasets and the problems they pose will also be an interesting journey which I can transfer across to my day job as an added bonus.