PeakD has been around for a long time, going back to the previous version of the chain 😊. They have continually building their web in small steps and have become the no.1 user interface for Hive.
There is always room for improvement, and this is the case for PeakD as well. Recently it was announced that there are a lot of new things to come in 2022 and they are hiring devs as well. At the moment PeakD is run by @jarvie and @asgarth.
Let’s take a look at some of the data.
Here we will take a look at the activity on the platform, the overall number of posts and comments, and the number of users. The top content creators for January 2022 will be presented as well.
The period that we will be looking at is from the creation of Hive, Apr 2020 till now.
Posts
First let us see the number of posts coming from the PeakD.
Here is the chart.
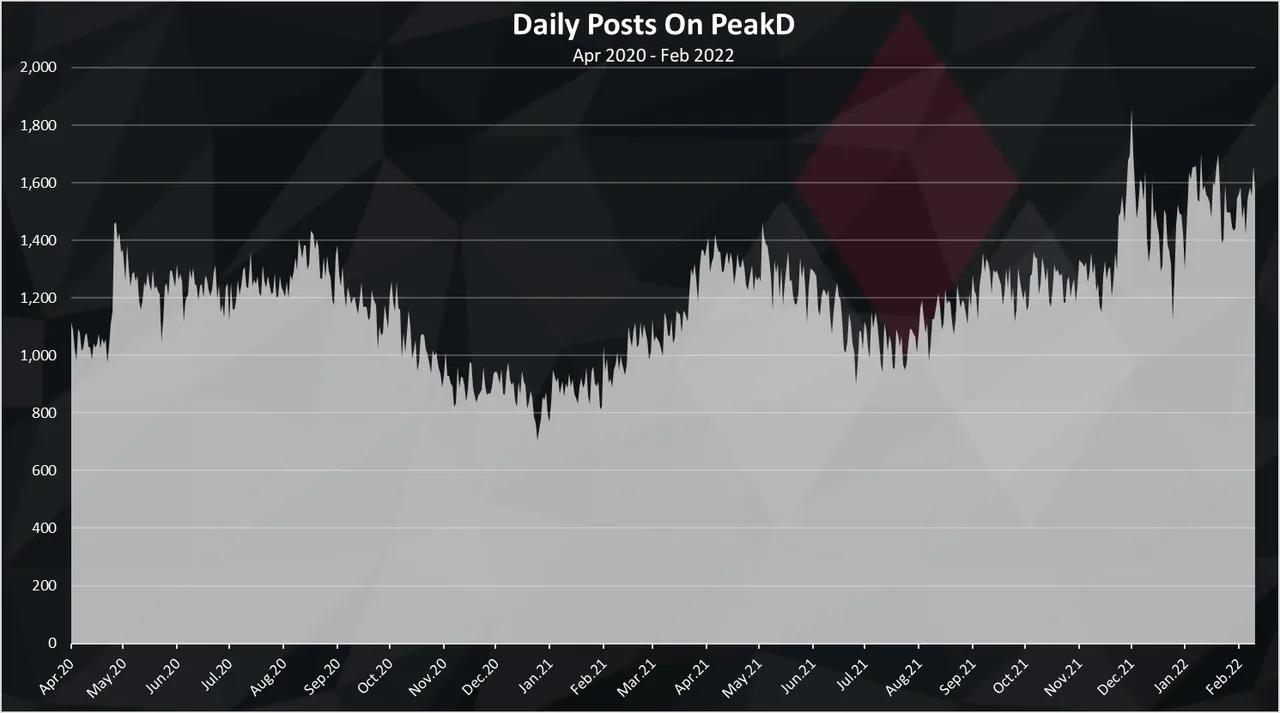
We can see that there was a spike at start in April 2020, then a downtrend towards the end of the year and in the first month of 2021. In 2021 there was an increase in the numbers up until May, a pull back for the summer and up again since then. In the last months there is an uptrend in the numbers of daily post made from PeakD reaching around 1600 post per day.
This chart follows the price a lot, just with a smaller volatility.
Comments
The chart above was only about posts.
What about comments?
Here is the number of comments made per day from PeakD.
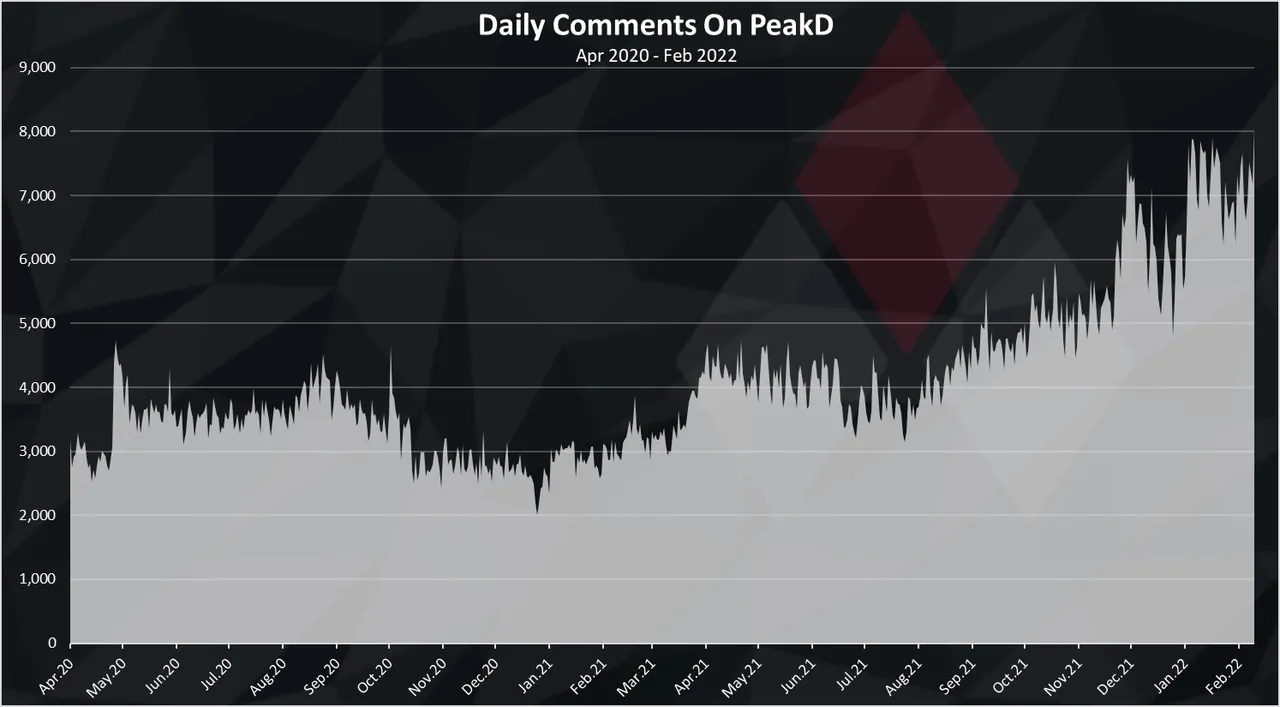
We can notice a much higher uptrend in the numbers of comments on PeakD in the last months. The growth is stronger in the comments then in the posts.
The numbers of comments per day has reached 8k per day in the last period.
Posts and Comments`
When we combine the posts and comments on one chart we get this.
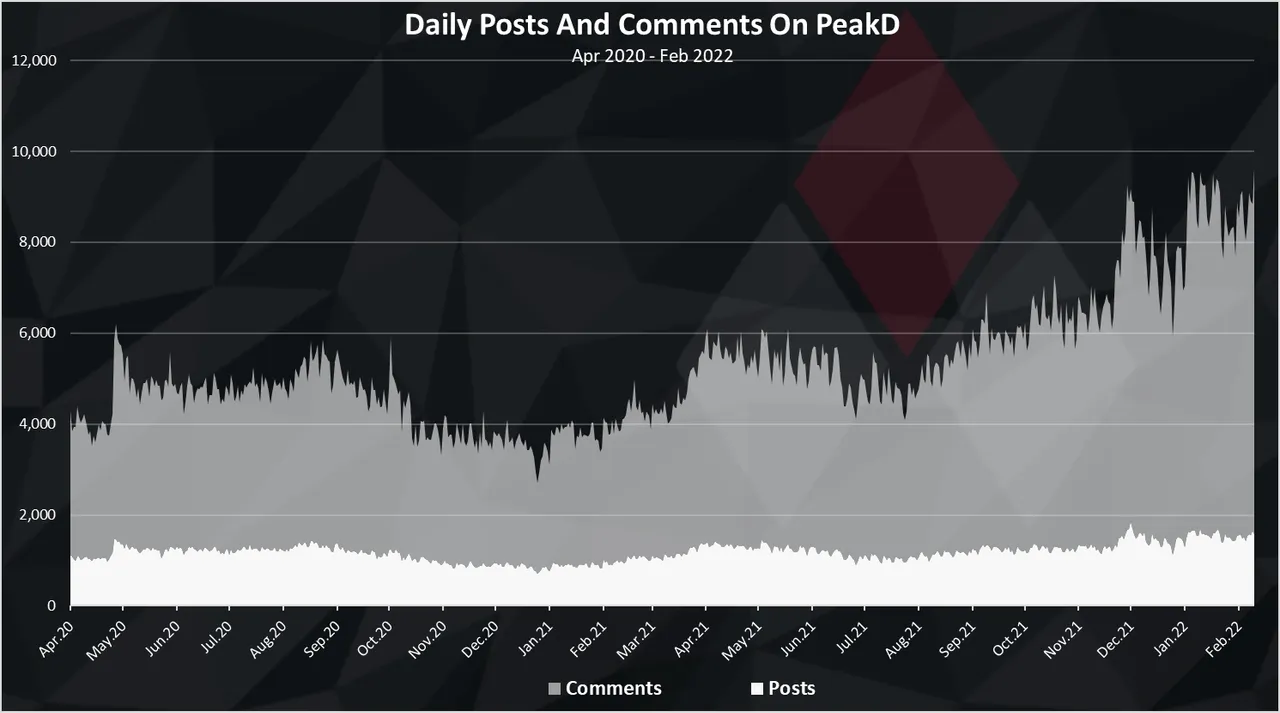
We can see the clear up trend in the numbers of posts and the even stronger uptrend in the numbers of comments. The ratio of comments to post is around 4.5 to 1 in the last period.
When we plot the numbers on a monthly timeframe we get this.
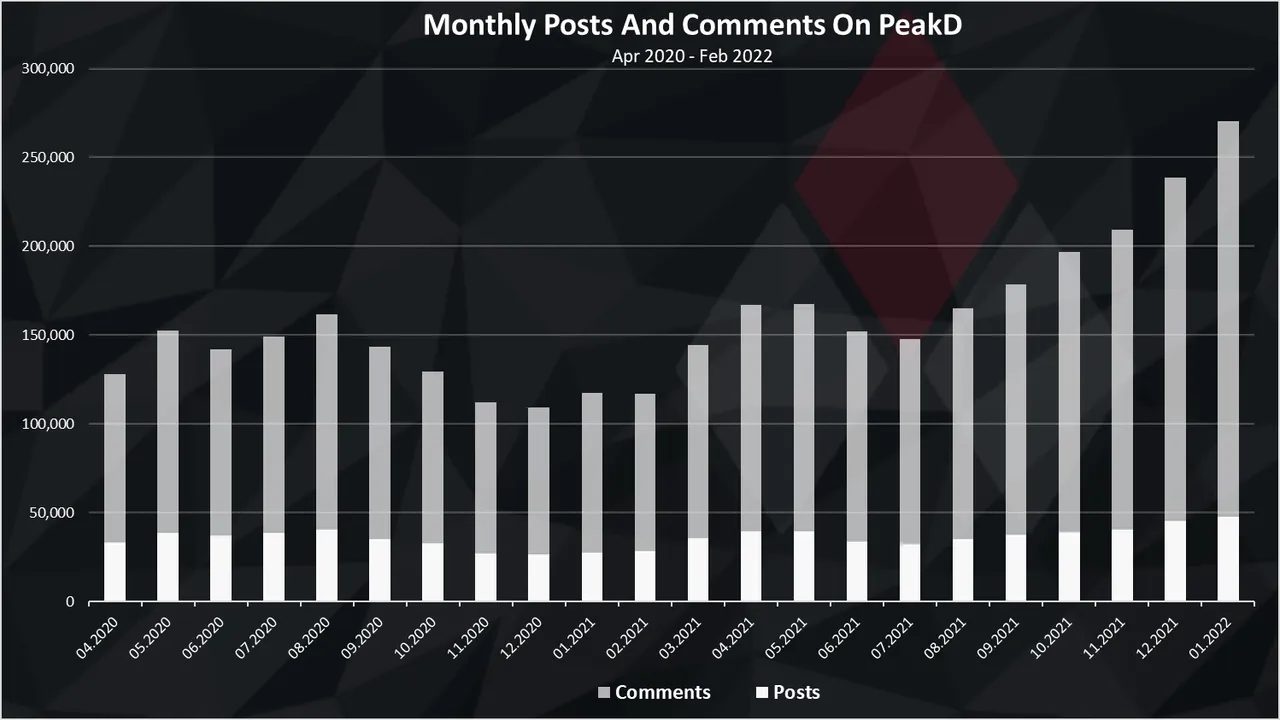
A similar trend as in the previous charts with a clearer representation of the growth in the last months. More then 250k posts and comments in Jan 2022.
Authors
How about the numbers of the authors on the PeakD. How many accounts are posting?
Here is a chart for the monthly numbers of accounts posting.
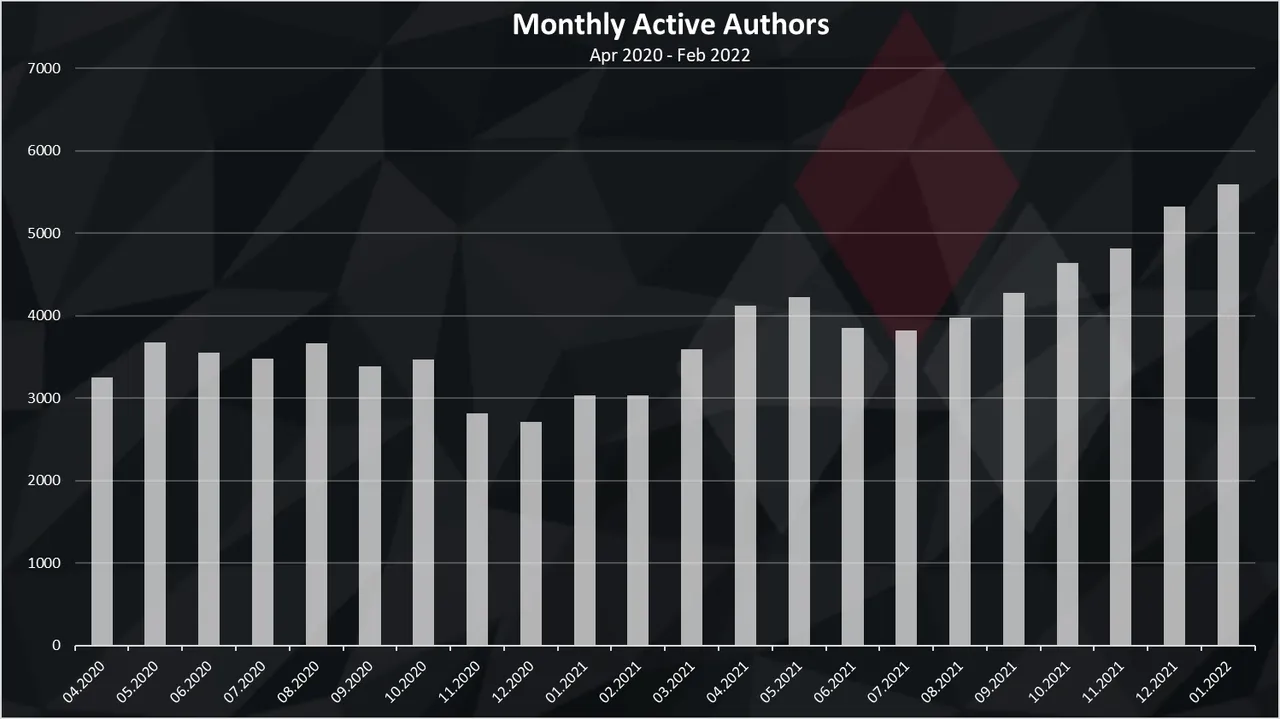
The up trend in the last month is recognizable here as well. In January 2022 there has been a total of 5.5k unique accounts that posted from PeakD, up from the 4k in the summer of 2021.
Next the number of unique authors that posted from PeakD. These are authors that posted directly through the frontend.
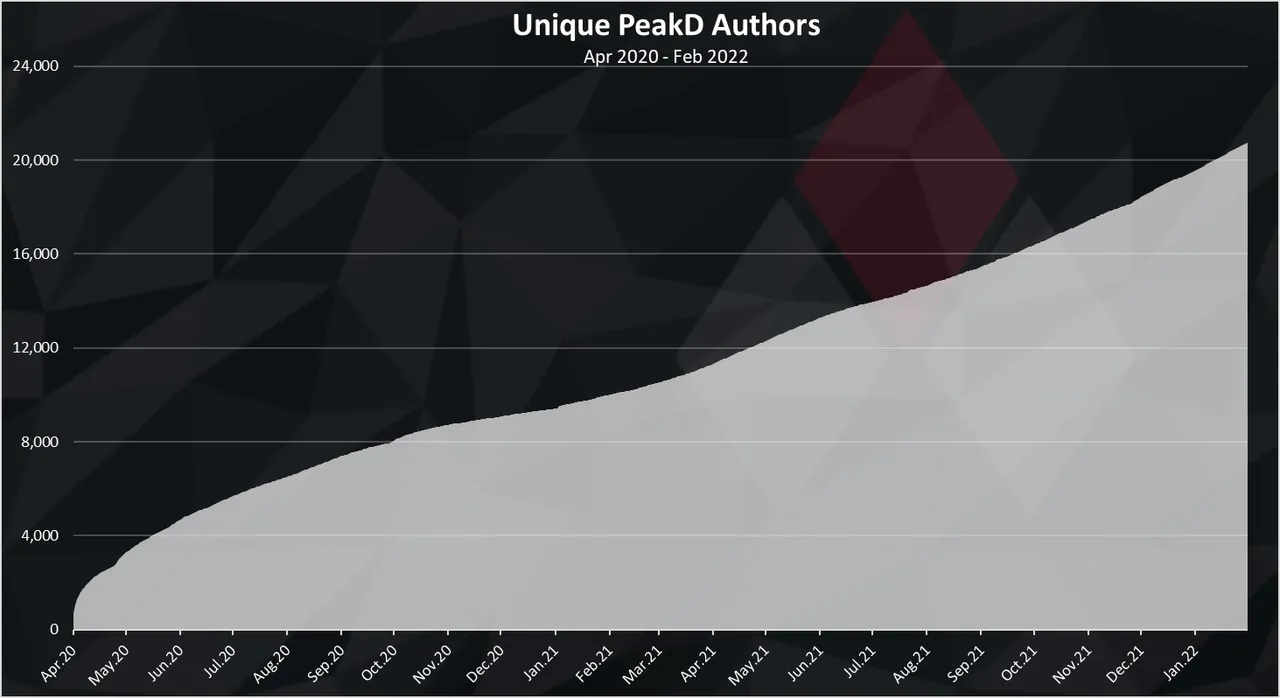
The number of unique PeakD authors is showing continuous growth.
There is a total of 21k unique authors that have used PeakD to post. In the last months there has been more then 1k new unique authors trying the frontend for the first time.
Authors That Posted The Most From PeakD in Jan 2022
Here is the rank of the authors that posted the most in January 2022 on PeakD.
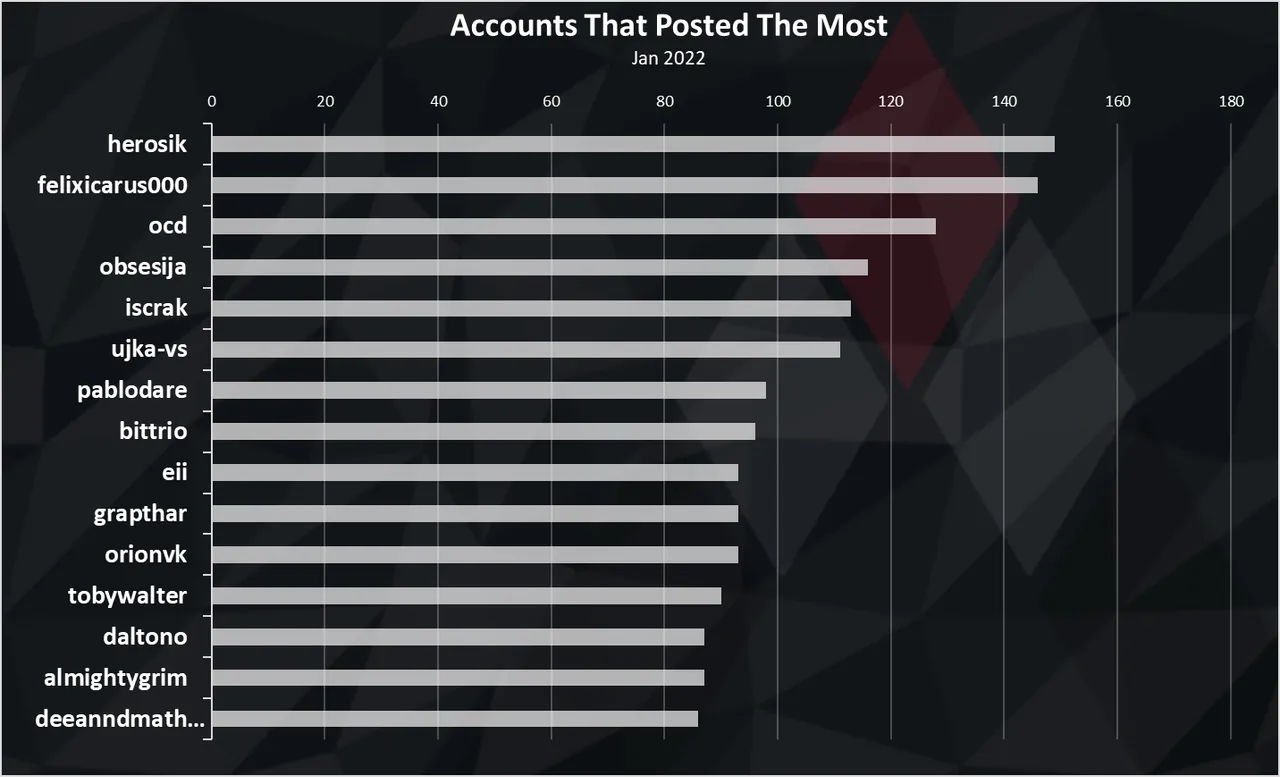
There seems to be some spam accounts at the very top.
There is some community run projects that report daily as the @ocd and some genuine account in the second half of the ranks.
Overall the PeakD platform has shown a great uptrend in the last months. All the growth until now has been only from building and to serve the exciting users on Hive. They haven’t yet engaged in massive marketing and onboarding on user base outside of Hive. @jarvie has mentioned in the past that they don’t like to market and onboard on a not finished product so they are building first and will do the onboarding later. With all the updates that are coming to Hive, especially the Resource credit system, maybe 2022 will be the year when PeakD reaches for the masses 😊.
All the best
@dalz