Analysis
Looking at the chart, the lowest point of $48,754 last March 7th has been broken on March 25 at $48,445 and that is 18 days (red horizontal line). In that 18 day period it formed an Arc in charts.
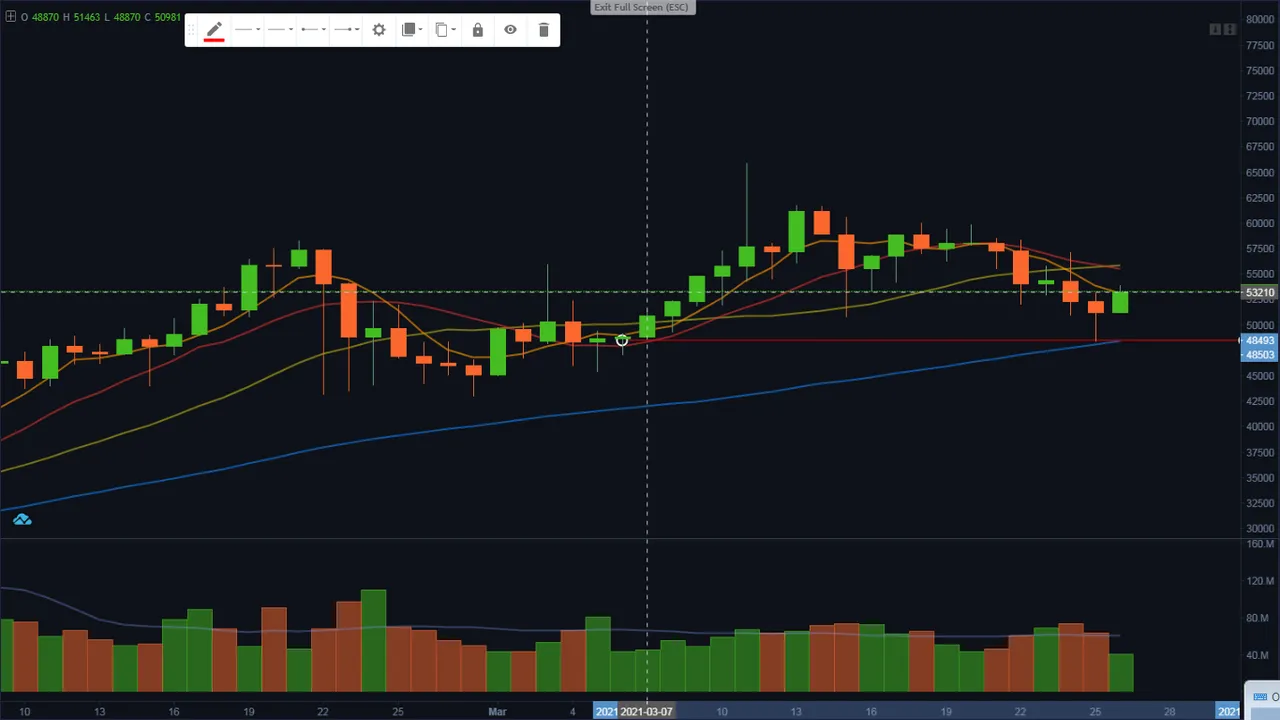
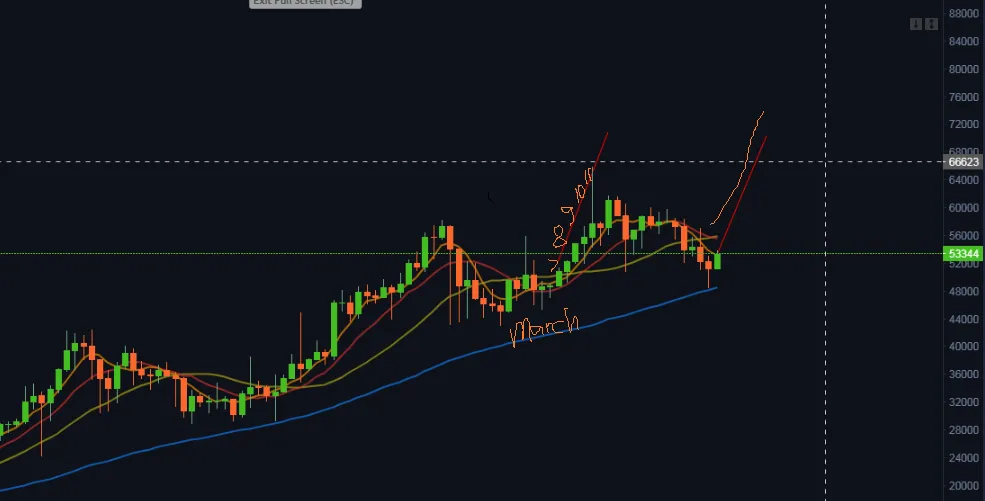
From March 7th on wards we could see a daily bullish price of Bitcoin and even shooting to the $65,743 price - all time high!
In that perspective, I can now see a pattern it should be a repeat pattern. Take a look back on March 8th to 11th it was a successive bullish trends daily.
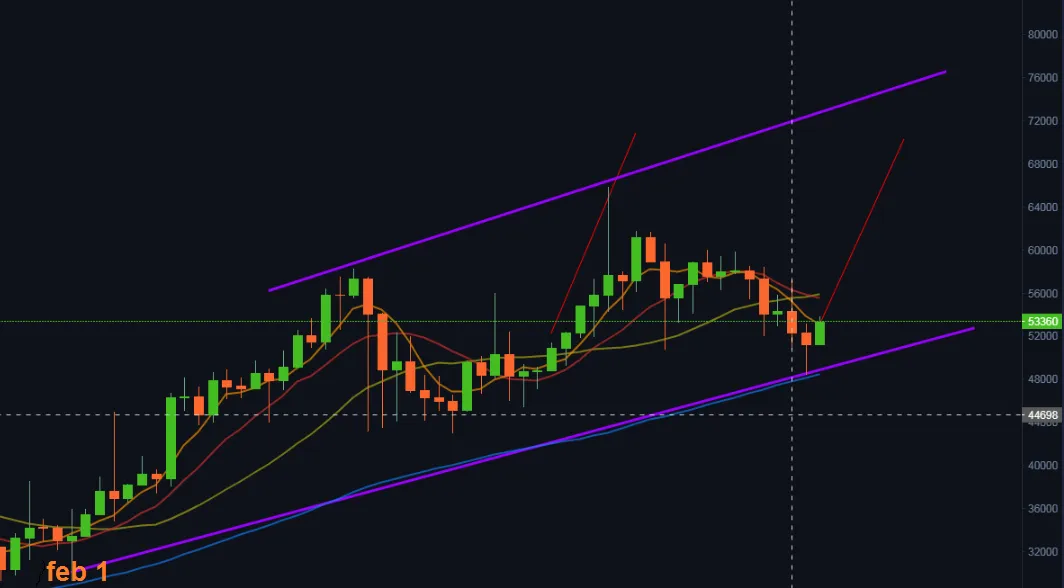
Below image, let's go back to February 1. Bitcoin dipped to $29k all through March until the 25th the purple line below clearly shows a descending line. That means there is no way Bitcoin can reach back to $30K. Again, take a look at the purple line above it is in parallel with the purple line below. It only means one thing - Bitcoin is going much higher in few weeks.
Conviction
Let's hold Bitcoin, or let's continue buying this cryptocurrency. There is so much profit in it.
My Trading Signal
BUY START: 53,131
STOP LOSS: 50,906
TAKE PROFIT: 56,600
DURATION: max 48 hours
Enjoy guys!