Kal’s Multi-Time Frame On Balance Volume Haar, also known as Kal’s MTF OBV Haar is a method/study for finding trending volume levels on stocks, indexes and cryptocurrencies using OBV, CMF and CCI over different time-frames (10m, 1H, 4H, 1D, 1W, 1M).
Upon adding to the 10-min chart, the sample Image in Tradingview looks as follows:
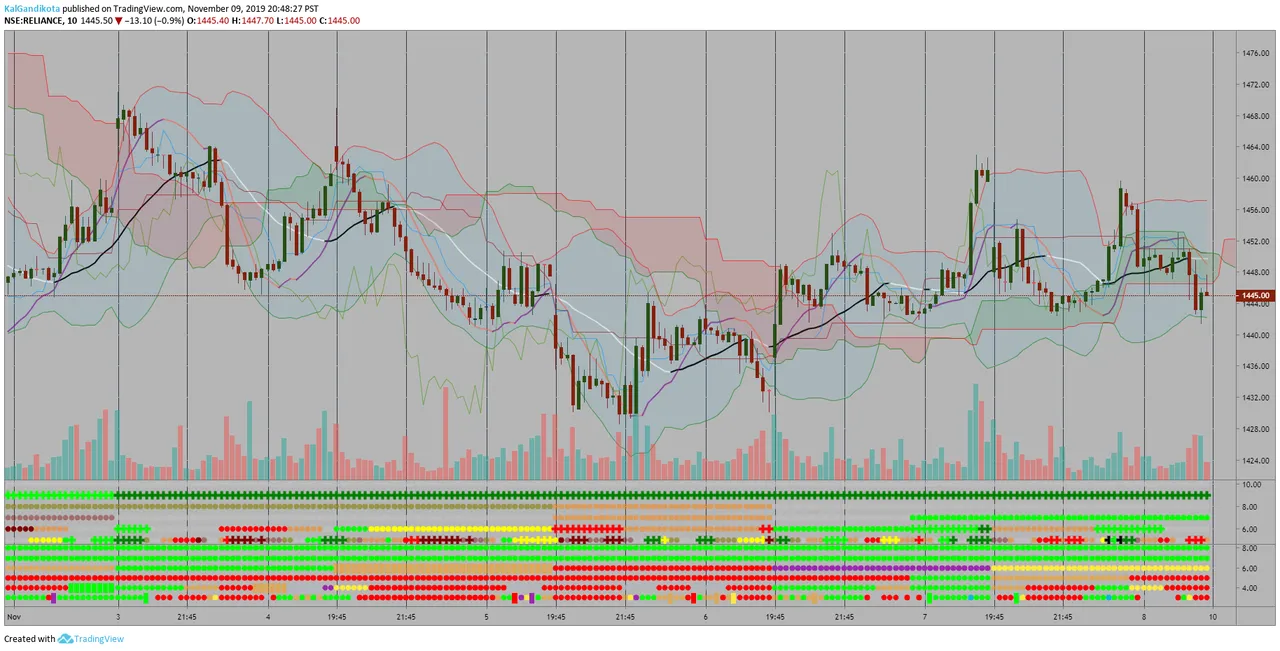
Note: Kal's MTF OBV Haar is the lower Plot. The upper plot is Kal's MTF ADX Rangoli Roller( ([https://www.tradingview.com/script/zbjpdcvd-Kal-s-MTF-ADX-Rangoli-Roller)] )
Kal’s MTF OBV Haar is made for Stocks/Cryptocurrencies/Forex. The input parameters may be fine-tuned for different types of assets and in those assets, it may be fine-tuned for different ticker symbols.
For the study of stocks, I used
For the study of crypto-currencies, I would update EMAs as follows:
In the study plot, the lowest row is 10m, row above is 1H, row above is 4H, then 1D, then 1W and highest row is 1M. (In a Tradingview chart, you may change different time periods to observe each row of MTF OBV HAAR with corresponding price bars.)
It’s best to wait and research for possibility of trend reversal during the following dots/bricks:
I am a disabled man. Therefore, I am not able to write in detail here today. More Details will follow as time permits. Please let me know if I am missing anything…
Legal Disclaimer: I published here so I get replies from fellow viewers to educate myself and for my daily expenses. Hence, if anyone uses this script for making their decisions, I am not responsible for any failures incurred.
Safe Trading!
Kal Gandikota
PS: If you found this script interesting and edifying please follow and upvote.
PS2: Please kindly donate for my daily expenses (atleast as you would on streets) at the following addresses:
PS3: For more information on OBV, CCI and CMF, please search internet or here yourself.
PS4: This study is intended for research in creating automated Python Trading Systems using Pandas(https://steemit.com/python/@chipmaker/how-to-find-guidance-on-building-python-based-cryptocurrency-trading-bots).
Test this code out free in the pine editor by creating a free account on https://www.tradingview.com. More details follow as time permits!
//BEGIN============================================
///////////////////////////////////////////////////////////////////////
//@version=4
//Author: KAL GANDIKOTA
// Kal’s Multi-Time Frame On Balance Volume Haar(Kal’s MTF OBV Haar)
// is a method/study for finding trending volume levels
// on stocks, indexes and cryptocurrencies using OBV, CMF and CCI
// over different time-frames (10m, 1H, 4H, 1D, 1W, 1M).
//
// Copyright (C) NOV 2019 KAL GANDIKOTA
//
// This program is free software: you can redistribute it and/or modify
// it under the terms of the GNU General Public License as published by
// the Free Software Foundation, either version 3 of the License, or
// (at your option) any later version.
//
// This program is distributed in the hope that it will be useful,
// but WITHOUT ANY WARRANTY; without even the implied warranty of
// MERCHANTABILITY or FITNESS FOR A PARTICULAR PURPOSE.  See the
// GNU General Public License for more details.
//
// You should have received a copy of the GNU General Public License
// along with this program.  If not, see <http://www.gnu.org/licenses/>.
//
// Please Kindly Donate for my Daily Expenses and Greater Works Than These
//
// BTC Wallet: 1NeDC1GvpFa49DFLuT1v28ohFjqtoWXNQ5
// ETH Wallet: 0x35e557F39A998e7d35dD27c6720C3553e1c65053
// NEO Wallet: AUdiNJDW7boeUyYYNhX86p2T8eWwuELSGr
// SteemID: chipmaker
//https://www.twitter.com/chipmaker_tweet
//https://steemit.com/@chipmaker
///////////////////////////////////////////////////////////////////////
study("Kal's MTF OBV HAAR", shorttitle="MTF_OBV_HAAR")

lengthema = input(9, title="Length of OBV EMA1 Signal Line")
lengthema2 = input(4, title="Length of OBV EMA2 Signal Line")

src = input(close, title="bar price type for OBV[close, hlc3, hl2, ....]", type=input.source)

cci1_length = input(10, minval=1, title="CCI1 Length")

cci_threshold = 0
cci_OBLevel = input(100, title="CCI Overbought Threshold")
cci_OSLevel = input(-100, title="CCI Oversold Threshold")

CMF_length = input(10, minval=1, title="CMF Length")
cmf_ob_threshold = input(0.6, title="CMF Overbought Cutoff", type=input.float)
cmf_os_threshold = input(-0.6, title="CMF Oversold Cutoff", type=input.float)

//OBV Function
obv(src) =>
    change_1 = change(src)
    cum(change(src) > 0 ? volume : change_1 < 0 ? -volume : 0 * volume)

//CMF Function
cmf(length) =>
    ad = close == high and close == low or high == low ? 0 :
       (2 * close - low - high) / (high - low) * volume
    mf = sum(ad, length) / sum(volume, length)
    mf

//calculate OBV
o = obv(src)

//Calculate CCI
c1 = cci(src, cci1_length)

//Calculate CMF
cmf1 = cmf(CMF_length)

//OBV EMA Overlay
obv_ema = ema(o, lengthema)
obv_ema2 = ema(o, lengthema2)

//CCI conditions
uzr = crossover(c1[1], cci_threshold) and crossunder(c1, cci_threshold)
dzr = crossunder(c1[1], cci_threshold) and crossover(c1, cci_threshold)
cNearZ = c1 > -15 and c1 < 15

//cmf conditions
cmf_corners = cmf1 > cmf_ob_threshold or cmf1 < cmf_os_threshold

//##### HAAR items color Selection #####
f_obv_ema_cmf_cci_color(o, obv_ema, Dcolor1, Ucolor1, cmf_corners, c, uzr, dzr) =>
    obv_ema_up = (obv_ema > obv_ema[1])
    obv_ema_dn = (obv_ema < obv_ema[1])
    oabove = (o > obv_ema)
    obelow = (o < obv_ema)
    color_1 = color.new(color.purple, 0)
    color_2 = color.new(color.silver, 30)
    color_3 = color.new(color.yellow, 0)
    color_4 = color.new(color.orange, 50)
    obv_ema_fc = (obv_ema_up or oabove) ? (dzr ? color_1 : (c > 0) ? Ucolor1 : color_2) :
                 (obv_ema_dn or obelow) ? (uzr ? color_3 : (c < 0) ? Dcolor1 : color_4) :
                 color.blue
    color_5 = color.new(color.aqua, 0)
    obv_ema_cmf_fc = cmf_corners ? color_5 : obv_ema_fc
    obv_ema_cmf_fc

obv1_fc = f_obv_ema_cmf_cci_color(o, obv_ema, #FF0000, #00FF00, cmf_corners, c1, uzr, dzr)
obv2_fc = f_obv_ema_cmf_cci_color(o, obv_ema2, #FF0000, #00FF00, cmf_corners, c1, uzr, dzr)

//##### Time Frame Adjustments #####
//obv1_finalcolor = security(syminfo.tickerid, "1", obv1_fc, lookahead=barmerge.lookahead_on)
//obv5_finalcolor = security(syminfo.tickerid, "5", obv1_fc, lookahead=barmerge.lookahead_on)
obv15_finalcolor = security(syminfo.tickerid, "10", obv1_fc, lookahead=barmerge.lookahead_on)
obv60_finalcolor = security(syminfo.tickerid, "60", obv1_fc, lookahead=barmerge.lookahead_on)
obv240_finalcolor = security(syminfo.tickerid, "240", obv1_fc, lookahead=barmerge.lookahead_on)
obvD_finalcolor = security(syminfo.tickerid, "D", obv1_fc, lookahead=barmerge.lookahead_on)
obvW_finalcolor = security(syminfo.tickerid,"W", obv2_fc, lookahead=barmerge.lookahead_on)
obvM_finalcolor = security(syminfo.tickerid,"M", obv2_fc, lookahead=barmerge.lookahead_on)

//cNearZ_1m = security(syminfo.tickerid, "1", cNearZ, lookahead=barmerge.lookahead_on)
//cNearZ_5m = security(syminfo.tickerid, "5", cNearZ, lookahead=barmerge.lookahead_on)
cNearZ_15m = security(syminfo.tickerid, "10", cNearZ, lookahead=barmerge.lookahead_on)
cNearZ_60m = security(syminfo.tickerid, "60", cNearZ, lookahead=barmerge.lookahead_on)
cNearZ_240m = security(syminfo.tickerid, "240", cNearZ, lookahead=barmerge.lookahead_on)
cNearZ_D = security(syminfo.tickerid, "D", cNearZ, lookahead=barmerge.lookahead_on)
cNearZ_W = security(syminfo.tickerid, "W", cNearZ, lookahead=barmerge.lookahead_on)
cNearZ_M = security(syminfo.tickerid, "M", cNearZ, lookahead=barmerge.lookahead_on)

//#####PLOTS#####
//plot1 = plot(cNearZ ? na : 1, color=obv1_finalcolor, style=plot.style_circles, linewidth=4, transp=0)
//plot5 = plot(cNearZ_5m ? na : 2, color=obv5_finalcolor, style=plot.style_circles, linewidth=4, transp=0)
plot15 = plot(cNearZ_15m ? na : 3, color=obv15_finalcolor, style=plot.style_circles, linewidth=4, transp=0)
plot60 = plot(cNearZ_60m ? na : 4, color=obv60_finalcolor, style=plot.style_circles, linewidth=4, transp=0)
plot240 = plot(cNearZ_240m ? na : 5, color=obv240_finalcolor, style=plot.style_circles, linewidth=4, transp=0)
plotD = plot(cNearZ_D ? na : 6, color=obvD_finalcolor, style=plot.style_circles, linewidth=4, transp=0)
plotW = plot(cNearZ_W ? na : 7, color=obvW_finalcolor, style=plot.style_circles, linewidth=4, transp=0)
plotM = plot(cNearZ_M ? na : 8, color=obvM_finalcolor, style=plot.style_circles, linewidth=4, transp=0)

//plot1_col = plot(cNearZ ? 1.5 : na, color=obv1_finalcolor, style=plot.style_columns, linewidth=4, transp=0, histbase=0.5)
//plot5_col = plot(cNearZ_5m ? 2.5 : na, color=obv5_finalcolor, style=plot.style_columns, linewidth=4, transp=0, histbase=1.5)
plot15_col = plot(cNearZ_15m ? 3.5 : na, color=obv15_finalcolor, style=plot.style_columns, linewidth=4, transp=0, histbase=2.5)
plot60_col = plot(cNearZ_60m ? 4.5 : na, color=obv60_finalcolor, style=plot.style_columns, linewidth=4, transp=0, histbase=3.5)
plot240_col = plot(cNearZ_240m ? 5.5 : na, color=obv240_finalcolor, style=plot.style_columns, linewidth=4, transp=0, histbase=4.5)
plotD_col = plot(cNearZ_D ? 6.5 : na, color=obvD_finalcolor, style=plot.style_columns, linewidth=4, transp=0, histbase=5.5)
plotW_col = plot(cNearZ_W ? 7.5 : na, color=obvW_finalcolor, style=plot.style_columns, linewidth=4, transp=0, histbase=6.5)
plotM_col = plot(cNearZ_M ? 8.5 : na, color=obvM_finalcolor, style=plot.style_columns, linewidth=4, transp=0, histbase=7.5)
//END============================================