bitcoin chart analysis
The bitcoin rises and then draws a small decline wave.
However, the trend line maintains its upward position.
If the bitcoin goes down, it belongs to the betting interval rather.
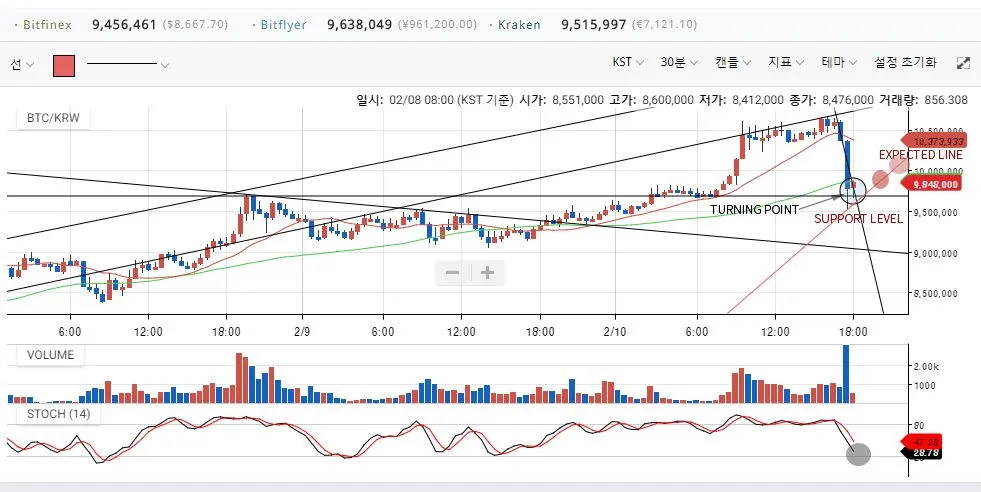
위 비트코인 차트를 보시면 상승 후 잠시 하락을 하였지만,
파동상 원리에 의하면 30분봉과 60분봉의 이격도가 벌어져서 좁히는 의미로 하락을 생각하면 좋을 듯 합니다.
따라서 겁을 먹기보다 30분봉 또는 60분봉 support level(지지선)에서 매수를 하면 좋을 듯 합니다.
The turning point is the support line for the decline and the starting line for the ascension.
and... The expected path of the bitcoin price is a red circle line with respect to the support line.
Let's hope the price of the bitcoin is going to up like my analysis.
Good luck !!!