This report is not to be considered as professional investment advice. Please do your own research.
Contact me via thesydneycontrarian@gmail.com.
Summary
This report extends on the previous report, “The Valuation of Key ASX-Listed Gold Mining Companies by Operating Performance, Reserves and Resources” by considering also the historical valuation ranges. 25 ASX-listed gold mining companies that have reached commercial production over 2012-2018 are considered. The current period appears to be similar to mid-2015 when the gold and crude oil prices (in USD terms) are at the same levels. That is, the price of gold is at the lower end of the range over the study period and crude oil price is trading at middle of the range. Even though the gold price in AUD terms is higher now than in mid-2015, the observed trend in the companies’ prices suggests that investors place more weight on gold price in USD terms. Results from this study also show that the market places greater weight on production and All-in Sustaining Cost (AISC) when valuing gold mining companies. These metrics are short to medium term in nature, reflecting performance that is more immediately observable as they translate more readily to free cash flows and profit generation. With respect to Ore Reserves and Mineral Resources, investors do not seem to be placing much weight on them when determining the company’s value. This appears to be consistent with the prevailing environment with lower gold prices (in USD terms) whereby investors are more focused on shorter term performance rather than longer term potential.
From this study, the results show that NST, EVN, AQG and SAR appear to be valued the most generously. These companies share common characteristic of significant growth in production (or anticipation of such), below average AISC implying superior efficiency, healthy growth of reserves and a healthy cash balance. Even though they trade at the upper end of their historical range under the different metrics, this reflects more a potential of re-rating the company stock rather than overvaluation. On the other hand, the companies that are most undervalued are RMS, SLR and MML. These companies have generally stable production with moderate AISC. However, they have not been valued more generously possibly due to a relatively low reserve base, suggesting that their long-term investment potential is deemed inadequate. While companies like RSG, BLK, PRU and RED are valued at the lower end of both the peer range and their historical range, they are confounded by operational complications, low cash balance or extended period of negative free cash flows, unstable performance or decline in production levels. These companies may offer high returns in the longer term, but they have substantial investment risk. Strongly performing companies that are fairly valued include NCM, OGC, RRL and SBM. These companies are valued fairly under the short-term metrics such as production and AISC-adjusted production (OGC, RRL and SBM) and may be somewhat undervalued under the long-term metrics such as reserves and resources (NCM).
As the gold price rises, which is likely to be the case given the increasing global financial and geopolitical instability, the valuation may become more favourable towards gold mining companies. In the meanwhile, the ASX-listed gold mining companies offer a diverse choice for investors, whether they seek short-term returns and stability or long-term potential.
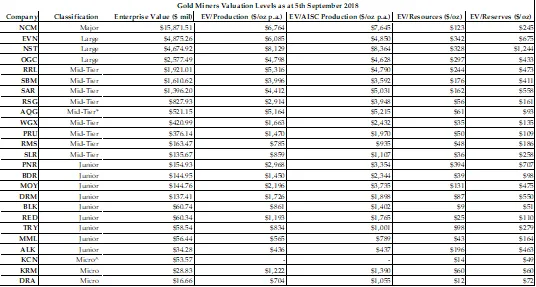
The current valuation results by different metrics are summarised in the figure below:
The table below summarises the current valuation levels for the sample companies relative to their historical range, expressed in quartiles:
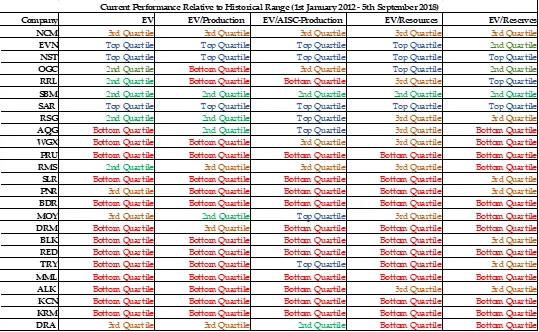
In interpreting this table, the key is to keep in mind that a company being valued at the top quartile of its historical range may not necessarily be overvalued, neither does the contrary imply that the company is undervalued. Rather, a company that is placed in the top quartile under all metrics may be at the stage where they are growing their business. A company that is placed in the bottom quartile under all metrics may be stagnating and facing operational or financial obstacles, or a combination of both. Before making any decisions, one is strongly advised to study the individual company and understand the context of their business.
Valuation of Gold Mining Companies Using Gold and Crude Oil Prices
Valuing gold mining companies is not well understood as many believe that their price is driven predominantly by the price of gold bullion, as determined by the Commodities Exchange (Comex) in Chicago or the London Bullion Market Association (LBMA) gold price fix. However, gold mining companies are like any other companies in that they generate revenue from sales, incur expenses through production, administration, marketing, financing and taxation. Furthermore, market investors also value gold mining companies based on their cash balance and ability to generate free cash flow after deducting for capital expenditures and financing costs.
Gold mining companies are possibly most sensitive to the following commodity prices – gold (plus silver and other commodities such as copper, zinc and lead that they mine and sell) and crude oil. The revenues are driven by the volume and sale price of what they produce while the expenses are driven by the production cost as well as administration, general and taxation expenses. Production cost is driven by crude oil price as mining requires substantial diesel consumption to operate mining vehicles and equipment. Interestingly enough, the relative price of gold to crude oil is a better indicator for the companies’ profitability. This is not going to be explored in this report, but it is worth the reader’s time to review this.
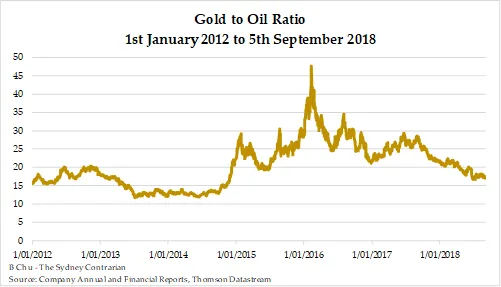
The following figures show the relative price between the price of gold in US dollars and Australian dollars as well as the price of crude oil as well as the historical gold to oil ratio:
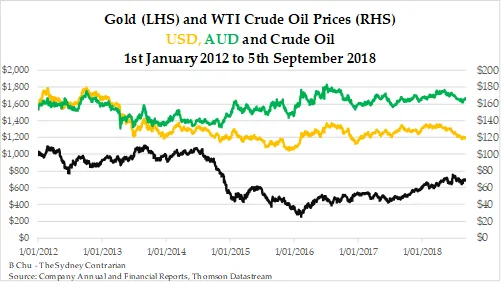
The price of gold in USD terms has declined from $1 574/oz at the start of 2012 to $1 198/oz at 5th September 2018. However, at the same time, in AUD terms, the price of gold has risen from $1 535/oz to $1 665/oz. This is due to the significant depreciation of the AUD relative to USD. As for crude oil, the price has fallen substantially from US$98.83/bbl to US$68.72/bbl during the same period. The decline in the crude oil price is due to the increase in supply of crude oil by OPEC and the US. Furthermore, another possible driver for the decline is the slowing down of economic activity as a result of the central banks entering into a tightening cycle since the US Federal Reserve ended asset purchases and currency printing at the end of 2014 and then raising interest rates from December 2015.
For ASX-listed gold mining companies, the decline in the gold price in 2013 drove their stock prices into a severe bear market. However, the more efficient mining companies recovered from the middle of 2014. These companies have mines based in safer jurisdictions, have lower operating costs and have sound balance sheets. The weaker companies with mines that have higher AISC, high leverage and low production levels. Some of these companies are currently trading at close to their record low levels, suggesting potential value and investment potential.
Overview of Companies
Current – 5th September 2018
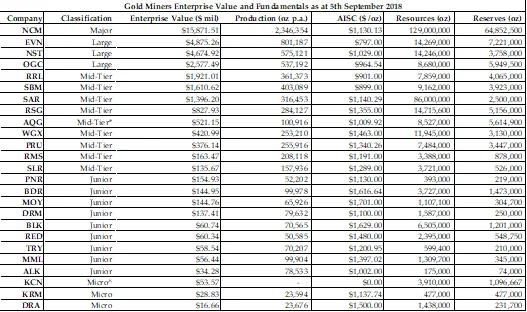
The 25 companies and their current EV and key metrics are given below:
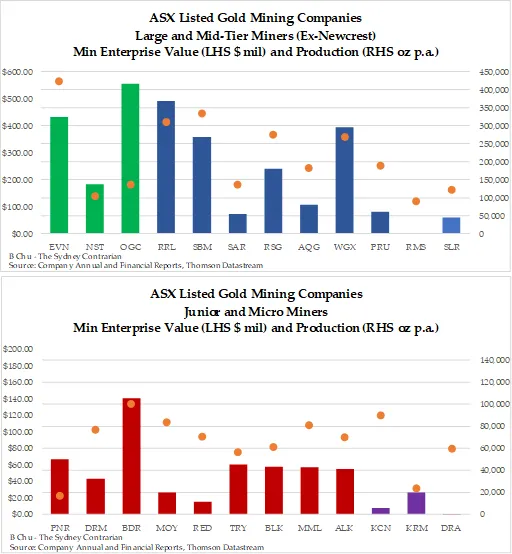
For ease of comparison, the following two figures show the relative EV and production levels for the gold miners in the sample, excluding NCM:

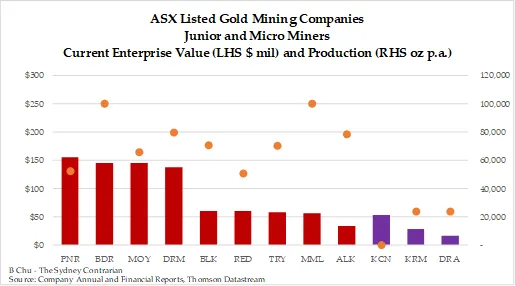
The ASX-listed gold miners that are in this sample are predominantly in the mid-tier and junior categories producing between 70 000-400 000oz p.a. Newcrest (NCM) is the largest ASX-listed gold miner by a significant margin in terms of its EV, production volume, resources and reserves. Evolution (EVN), Northern Star (NST) and Oceanagold (OGC) are the three large miners that are producing between 500 000-800 000oz p.a. Northern Star announced on 30th August 2018 that they will acquire the Pogo mine in October 2018, which will propel this miner ahead of EVN with production expected to be 850 000-900 000oz p.a. in 2019. The large miners have generally lower AISC as a result of the economies of scale enjoyed when production exceeds 500 000oz p.a. These miners have relatively large reserves and resources, exceeding 3Moz and 8Moz, respectively. NST has lower reserves but it is worth noting that they have a history of converting their resources into reserves efficiently from their acquired mines.
The mid-tier miners have a relatively diverse performance range. The top performers, St Barbara (SBM), Regis (RRL) and Saracen (SAR) are characterised by higher production volume and below average production cost even at their production level. Furthermore, they have a strong cash balance that is growing quickly as a result of higher efficiency in converting mined ounces into cash.
At the bottom end, we have Silver Lake (SLR), Ramelius (RMS) and Perseus (PRU). They are interesting since they are being priced at the lower end of their category peers for different reasons. SLR is ranked lowest as it produces the least among its peers but of note is their strong cash balance that exceeds $85m. While Alacer (AQG) currently produces less gold than SLR with the recent production of 120 000oz p.a., this is an anomaly. RMS is interestingly ranked second from the bottom of its peers by EV possibly since investors are warming to their acquisition of Edna May last year that lifted their production from 110 000-130 000oz p.a. to 200 000oz p.a. As this report is being written, they have announced a takeover bid for Explaurum (EXU), a late stage development company, in a 1 for 4 scrip offer. This will see them increase their reserves by almost 0.5Moz and resources by just under 0.7Moz. PRU is ranked third last despite producing over 250 000oz p.a. and has substantial reserves and resources. A possible reason for PRU being priced at this level is due to the company’s poor operational reliability, having reported highly variable AISC on production in the past four years.
Resolute (RSG) has an EV of around $830m though compared to its production volume, reserves and resources suggest that they should have a substantially high EV. The reason for this is due to RSG committing over $250m into expanding their mines over the past two years and production has decreased while AISC has risen sharply. The cash burn has left many investors disappointed. AQG has an EV exceeding $500m despite delivering just over 120 000oz of gold annualised over the last six months. However, the market is aware of the substantial reserves base of AQG and their Cǫpler Sulfide project will soon begin production. AQG spent over $600m to develop the mine and it is expected to deliver 4Moz over 20 years. This justifies the market’s willingness to pay a higher price despite the lower reported production than its peers. Westgold (WGX) has an EV of less than $450m and this appears to be driven by declining production volume and a rising AISC that has led to them delivering negative operating cash flows. Interestingly enough, WGX has a very high level of resources exceeding 10Moz, though substantially lower reserves of 3.3Moz. This significant disparity between the reserves and resources may provide insights into why WGX has been producing at a high AISC.
Next are the junior miners that produce between 50 000-150 000oz p.a. 9 junior miners have been included in the sample. Interestingly, Pantoro (PNR) has the highest EV in the group, even though coincidentally it has the second lowest annual production. With an EV of $155m, this is comparable to RMS and SLR. The reason is due to PNR delivers high grade gold, around 7g/t, from their underground Nicholson mine. Thus, they are able to generate positive operating cash flows and completely repay their debt incurred to build the mine. Beadell (BDR) has the second highest EV in the peer group at $145m, edging just ahead of Millennium (MOY). BDR has the highest reserves in the peer group that exceeds SLR and RMS but high debt levels and production impediment have led to them needing to raise capital twice, at very dilutive levels. The market has priced MOY not so much on the most recent financial year’s performance, which is plagued by higher AISC as a result of reduced production in the first half year. Instead, they have accepted that MOY is developing their Nullagine mine to deliver at a rate of 100 000oz p.a. by the end of the year. The company has released a report on 11th September 2018 stating they have been able to produce at a rate of 100 000oz p.a. already. Furthermore, they have significantly increased their reserves, after accounting for depletion from mining. Management has been able to convert resources into reserves over the past two years at very low costs, thus instilling confidence for the future.
Doray (DRM) closely follows this group with an EV of just under $140m. DRM has stabilised their operations at the Deflector mine, after having put Andy Well, a high grade mine but plagued with operational problems, on care and maintenance. The drilling results for the Deflector mine have been encouraging and it is expected that production will continue to rise in the future years to approach 100 000oz p.a.
The next five companies in this category all have an EV of below $70m, suggesting that they are either substantially undervalued or they are deemed by the market to be facing potential operational or financial distress. Blackhams (BLK) and Red5 (RED) have both faced liquidity and operational concerns as a result of high AISC in their mine development. Troy (TRY) has improved their production efficiency with lower AISC but at the same time, they have a low cash balance of $1.1m despite the decrease in the net debt from almost $24m to $12m. The low cash balance is a significant factor keeping the stock price down. The company has generated positive operating cash flows for the previous financial year. Medusa (MML) has been subdued in its valuation as a result of substantial reported Net Loss After Tax amounting to almost $70m, but it is worth noting that the company has generated a modest positive increase in cash balance. Production has increased to approach 100 000oz p.a.
Alkane (ALK) is another interesting case in that the company has a modest gold production of around 80 000oz p.a. with a large cash balance of approximately $70m. The gold production is expected to taper off and they will return to development stage, especially a major zirconium mine. This may explain why the company’s EV is low.
Finally, we have three companies in the Micro category, being Kingsgate (KCN), Kingsrose (KRM) and Dragon (DRA). KRM and DRA delivered around 20 000oz p.a., meaning that their AISC is likely to be volatile and relatively high. Also, at this low level of production, these companies would be marginal cash generators and it would be volatile in a yearly basis. Such factors would justify a much lower market capitalisation. It is worth noting that KRM was able to deliver positive operating cash flows in the past financial year as a result of improved operating efficiency. However, their production volume has suffered from previous years as a result of the closure of their Talang Santo mine. DRA is currently seeking to list in the Hong Kong Stock Exchange and raise funds to develop their Fabolinden mine, with their Orivesi and Jokisivu mines delivering a small amount of gold that is costing the company more than the revenues generated from gold sales.
Maximum and Minimum Ranges
Data regarding the companies’ EV and key performance metrics as at the date of their highest and lowest market capitalisation were collected in order to determine the ranges in which these companies traded. The period being studied is the later of 1st January 2012 and the quarter after they achieved commercial production. The assumption is that when the company traded at their highest market capitalisation, they similarly had a maximum EV during the same period and similarly for the case where they had the lowest market capitalisation. I understand that this assumption may be naïve since some gold miners can trade at a much lower market capitalisation as a result of being weighed down by substantial debt (as was the case with St Barbara in 2014) so their EV would consequently be higher. However, the assumption may cause this analysis to fail to capture the absolute maximum and minimum EV, though without necessarily detracting from the overall conclusions.
The tables for the companies and their key metrics as at the dates of their maximum market capitalisation, as well as their comparative EV and production levels sorted into their categories (ex-NCM), are given below:
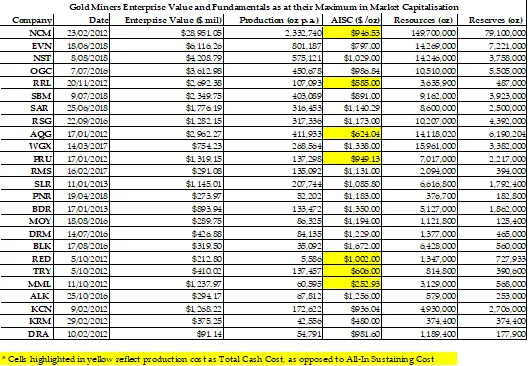
The EV and production levels as at the date when the gold mining companies had the highest market capitalisation showed substantial variation across different companies even within the same category. Note that these companies achieved the highest market capitalisation are on different dates. If the mining companies achieved this in 2012 and early 2013 when gold price was between US$1 550-1780/oz, the market capitalisation would be substantially higher relative to their production level, such as with RRL, MML and KCN having an EV of over $1 billion while production is less than 200 000oz p.a. During this period, the crude oil price was between US$80-105/bbl, meaning the gold to oil ratio would fluctuate between 15-20. The average gold to oil ratio over the entire period of study is 20.67. Thus, this period may be associated with gold mining companies being overvalued as a result of gold price being high and the market being bullish.
Since August 2014 when crude oil prices declined almost 50%, the production costs of the larger mining companies such as NCM, EVN, NST, OGC, SBM and SAR similarly fell and their economies of scale allowed them to maintain low AISC and hence an extended period of generating free cash flows. This also facilitated a number of gold mining companies that achieved maximum market capitalisation in 2016, during the period when gold prices were US$1 300-1 400/oz and the crude oil price had fallen to below US$50/bbl. These companies were more modestly priced relative to their production level. For example, RSG was trading at EV of almost $1.3 billion while producing 300 000oz p.a. while DRM traded at EV of $430m while producing just under 84 000oz p.a. These levels are by no means in bubble territory, although they were generously valued.
Some of the top performing companies achieved their highest EV this year, especially as these companies began to expand their production through acquisitions or developing their mine properties. EVN achieved a maximum EV of over $6 billion with annual production of just over 800 000oz p.a. while NST achieved an EV of $4.2 billion with annual production of 575 000oz p.a. With NST announcing on 30th August 2018 it is acquiring the Pogo mine, their EV has spiked from $4 billion to $4.7 billion and their production is expected to be between 850 000-900 000oz p.a. for the 2019 financial year.
Next, the table and figures for the gold mining companies in terms of their EV, operating and resources/reserves metrics at the date of their minimum market capitalisation are given below:
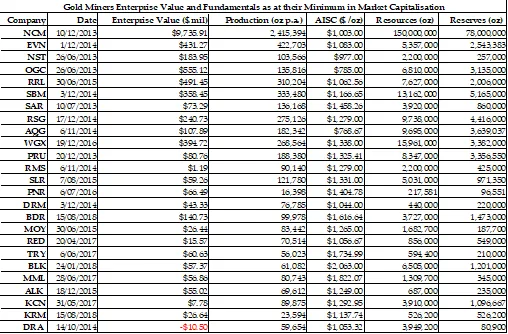
The EV of gold mining companies at the time when their market capitalisation was at the minimum show very interesting results. Other than NCM that had an EV of almost $10 billion, the EV of the other companies in the sample was less than $600 million. Even mid-tier gold mining companies such as AQG, KCN, NST, PRU, RMS, SAR and SLR were valued at as little as $10m despite producing over 100 000oz p.a.
The most efficient gold miners bottomed at the end of June 2013, after 10 weeks of the gold price falling sharply when the bullion banks coordinated their massive selling of paper gold contracts during 12th to 19th April 2013 and 20th to 25th June 2013. However, the most severe period in terms of valuation was in late 2014, when the gold price had been trading at the lowest level in AUD terms while the crude oil price began falling but the effect has not been passed through to some of these gold mining companies. During this period, RMS had an EV of just over $1 million while DRA had a negative EV, meaning that investors could purchase the company for less than their cash balance. This absurd level of pricing provided investors with spectacular gains in the next 18 months, if they had the courage to purchase when even the most seasoned gold mining company investors were at the end of their tether.
The VanEck rebalancing occurring between April to June 2017 also contributed to substantial stagnation of prices for the gold mining companies, and some junior gold mining companies such as KCN RED, TRY and MML reached the bottom at this time. However, note that KCN and RED traded at their record lows because the Thai and Filipino governments ceased their operations during that time and thus their production was suspended. Thus, their valuation was driven by company specific issues.
Current Valuation Relative to Historical Range
At the time of writing this report, there is wide variation in how gold mining companies are valued relative to their historical range. The current gold price is on the lower end of the historical range while crude oil is in the middle of the range. The gold to oil ratio is also in the lower end of the range. Thus, gold mining companies are operating in an environment that is relatively challenging.
A comparable period to consider is the middle of 2015 when the gold and oil prices were at comparable levels. During this period, the stronger performing companies (represented by lower AISC of below A$1 000/oz, generating substantial free cash flows each quarter and have a comfortable net cash position) were valued at close to fair value. The average companies were undervalued relative to the historical range while the weaker companies, those producing at higher AISC above $1 400/oz, low cash reserves and high net debt, were valued close to the minimum of the historical range.
Similarly, the top performers in this industry, being NST, EVN, RRL, SBM and SAR, are currently valued close to or at the top of the historical range. For the mid-tier (especially those below the median in the group based on EV), junior and micro mining companies in this sample, their EV is in the lower and even the bottom of the historical range. This disparity in valuation may offer substantial opportunity now and it is worth investigating further.
Enterprise Value
The EV range provides some insight into how the gold mining companies are performing relative to its own history. This metric should only serve as a starting point as some companies have changed their profile over the period studied, either through their production, costs, reserves or resources. A company that is valued at the upper end in the historical range does not necessarily mean it is overvalued, and the converse should not be an indicator of undervaluation. Rather, the company may be valued at this level due to the company undergoing transformation or is decline. Knowing the current level in context of its historical range will allow one to delve further to understand the context of the company’s performance and future outlook. In turn, one can be able to form a better-informed view on the company’s valuation and whether it is worth investing.
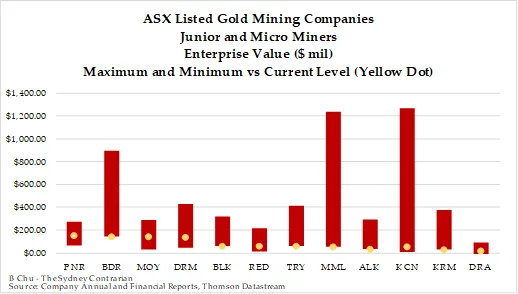
The figures below show the current EV relative to its historical range for NCM, the large miners, mid-tiers, junior and micro miners:

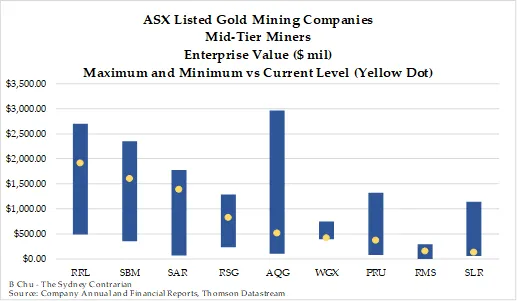
The figures show that the larger and well performing gold mining companies are valued at closer to the upper end of the historical range. In particular, NST, EVN and SAR have an EV close to the maximum. These companies have expanded their production and have been generating substantial free cash flows, thus attracting investors. SBM, RRL, RSG, OGC and RMS are valued above the median of the range, demonstrating that investors are similarly positively inclined to purchase these stocks. These companies have similarly delivered lower cost production and generated good cash flows. OGC would be valued higher if not for the net debt of $120m and the delay in increasing production to exceed 600 000oz p.a. RMS lies above the median of the historical range because their historical minimum is exceptionally low.
MOY, PNR, NCM and DRA are valued such that they are in the third quartile of the historical range. These companies have lower production volumes and are have moderately high AISC that are expected to fall in the coming quarters. This is why their valuation is lower but not as low as their peer group. The exception is NCM, which is valued at this level due to the slow paying down of their substantially large debt inherited from 2010 when they purchased Lihir Gold. NCM has also been unable to sustain an increase of their annual production to the 2.5Moz level, even though this had been on their agenda for the past five years. While they are delivering production at relatively low AISC, investors are not yet convinced that this justifies a higher price.
Finally, the analysis shows that the majority of the gold mining companies are trading at the bottom quartile of their historical range. These companies have been plagued by a wide range of problems ranging from persistently high AISC (WGX, PRU, BDR, BLK, DRM), low cash balance threatening short-term liquidity (RED, KCN, BDR, MML, TRY), operational delays and complications (WGX, RED, KRM, BDR, BLK), mines approaching end of production (ALK) and political interventions leading to mine shutdowns or developmental delays (RED, KCN, KRM). Interestingly, SLR is valued at close to its historical minimum range but they do not face any of the problems mentioned above. This may be worth investigating.
While the current EV levels relative to the historical range may provide us with how the company’s value is based on the market’s enthusiasm for purchasing the stock and their net debt position, further insights can be gained from the valuation based on operational performance and gold reserves/resources.
Valuation Based on Annualised Production
With respect to the valuation based on annualised gold production, the measure EV/Annualised Production may be helpful in providing guidance for the short to medium term. The intuition behind using annualised gold production is that a larger producer would likely be able to use economies of scale to reduce costs and increase profitability. Refer to a previous report “The Valuation of Key ASX-Listed Gold Mining Companies by Operating Performance, Reserves and Resources” that showed how market investors value gold mining companies roughly based on their production level. The companies that produce greater volume are valued higher. An approximate range exists and this may partly explain why some mining companies are re-rated when their production increases beyond a particular level.
The figures below show the current levels relative to the historical range of the EV/Annualised Production:
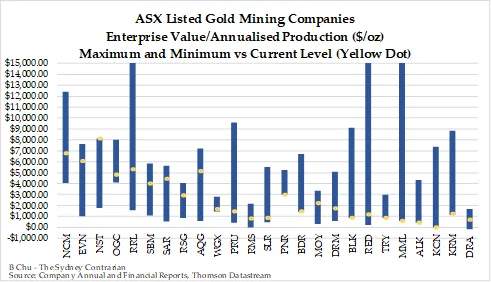
The figure above shows that the trend in the current levels relative to the historical range using the EV/Annualised Production measure are closely related to the EV. Furthermore, the values seemed to show that the market ascribes premiums to larger producers with significant gaps between each category. We will use the results from the previous report on valuation using different measures to determine how the companies are valued relative to production. The report found that the major and large gold mining companies are valued at above $6 000/oz, mid-tier mining companies at $2 000-5 000/oz and junior and micro mining companies at $1 000-2 000/oz.
Based on this, we find that OGC, WGX, PRU, SLR, RMS, BLK, TRY, MML and ALK are trading below the range using this measure. On the other hand, NST, RRL, AQG, PNR and MOY are trading above the range. These companies should be explored closely before one can conclude whether they are indeed overvalued or undervalued since the current prices are driven by company-specific factors.
The companies trading closest to their maximum range are NST, EVN, SAR, AQG and RSG. With the exception of AQG and RSG, these companies have enjoyed substantial growth in their production and improved operational efficiency. They are also the larger producers and hence are trading at a premium relative to those that produce less gold. AQG is valued in anticipation of the Cǫpler sulphide project entering into production. RSG is valued at a relatively high level under this metric due to the company’s lower production for 2018. Their current value may imply the market’s expectation of higher production as a result of their expansion of the Syama and Ravenswood mines.
RRL, SBM and MOY are trading above the median of the valuation range, when the RRL outlier is adjusted out since the maximum relates to when RRL was just entering into commercial production level in 2012. Both RRL and SBM are valued at this level due to their strong cash flow generation and the expectation that they will both expand their production to 500 000oz p.a. in the next few years. On the other hand, MOY is valued at this level due to the low production level for 2018 at just over 65 000oz p.a. although they are expected to increase their production to exceed 100 000oz p.a. for 2019.
DRA, RMS, NCM and DRM traded at the third quartile of the valuation range. Looking more closely, they face different circumstances and it cannot be concluded that they are all modestly undervalued. DRA is trading at this level as a result of low production of 23 000oz p.a. However, they are not undervalued at this stage since they have low cash reserves, beginning to rely on debt funding and a need to raise capital to develop their next gold project. RMS appears undervalued using this metric when one considers their increased production and a healthy cash balance, as well as the potential takeover of EXU. NCM appears undervalued using this metric since they are producing around 2.3Moz p.a. and at $6 764/oz valuation, it is below NST. This level is within the range of large mining companies, and at the lower end for major mining companies. DRM is trading at close to the bottom quartile as a result of the closure of their Andy Well mine although confidence is slowly returning due to results suggesting their Deflector mine is improving operational performance for 2019.
Many companies are currently trading at the bottom quartile of its historical range, namely OGC, WGX, PRU, SLR and virtually all the junior and micro mining companies. With OGC, the operating costs are low and they have substantially increased production. However, they may have been valued generously in the past due to the substantial copper credits from their Didipio mine that has brought their AISC to levels that are well below the peer average. As for WGX and PRU, the production is above 250 000oz p.a. but the higher AISC and operational unreliability have kept investors from purchasing their stocks at higher prices. SLR has been mentioned previously as being possibly undervalued. Even when adjusting for its production that puts them marginally in the mid-tier category, they are still trading at unusually low levels.
The junior and micro mining companies are almost all trading at the bottom quartile of the historical range under this measure. This is an interesting finding and may suggest that substantial value may exist in this group, although they come with high risk.
Valuation Based on AISC-Adjusted Annualised Production
As mentioned in the previous report, the market not only considers production volume but production efficiency when valuing gold mining companies. The production efficiency can be measured using AISC and this can be used in combination with annualised production. Using this measure yields additional insights into how the companies are valued relative to their historical range and also against its peers. This report will now explore how the valuation levels change when the annualised production is adjusted for AISC.
The figure below gives the valuation levels for the gold mining companies in this sample:
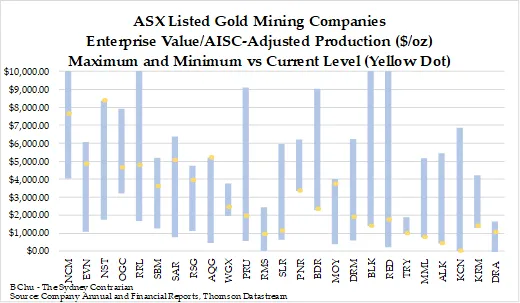
Given that the average AISC of gold mining companies is approximately $1 200/oz, then the valuation ranges needs to be adjusted. For the major and large gold mining companies, the companies in the sample have traded in the $5 000-$6 500/oz range, mid-tier mining companies $1 800-$4 000/oz and junior and micro mining companies $800-1 800/oz.
The results here suggest that including the AISC into the valuation measure, the trends change substantially. Firstly for the major and large gold mining companies, NCM is no longer below the valuation range and EVN is now below the peer range. NST has increased moderately to almost $8 400/oz from $8 100/oz. Among the mid-tier companies, RRL, SAR and AQG are valued above the peer range. These companies have this value as a result of improved production efficiency (RRL and SAR) while for AQG it is due to anticipation of substantial increases in future production. RSG is valued at the upper end of the peer range as a higher AISC penalises them under this valuation metric. PRU and WGX are no longer valued below the peer valuation range as their high AISC is accounted for using this metric. RMS and SLR still are below the peer range.
With junior and micro gold mining companies, when AISC is included in the valuation metric, the results show that many of these companies that are below the peer range under the EV/Annualised Production are not below the peer range under this metric. BLK and TRY are within the peer range under this metric while BDR and DRM that are within the peer range under the previous metric but are above the peer range under this metric.
In terms of the gold mining companies trading against their historical valuation, the results show that more companies are valued at a higher part of the range under this metric than under the EV/Annualised Production metric. When the AISC is included in the metric, this can adjust down the production volume. Thus, the valuation level would be adjusted upwards. However, since more companies are trading at a higher level in their historical range, this suggests that some companies have either been more generously valued or because their current operational performance has declined.
When reviewing the companies that are trading at a higher end of their historical valuation range under this metric than the EV/Annualised Production metric, namely NCM, OGC, RRL, RSG, AQG and MOY, they appear to come from the major, large and mid-tier gold mining companies with higher production. Similarly, the companies that are at the lower end of their historical range, such as OGC, WGX, PRU, SLR, BDR, BLK, RED, MML and KRM, would generally show that they are facing some operational or financial issues. The results here suggest that the companies are being more generously valued now if they deliver higher production after adjusting for AISC. Given the gold price currently is at the lower end of the range over the period studied, investors are more cautious about buying gold mining companies, setting aside funds for the better performing and financially stable companies. The mood for taking higher risk in the short to medium term seems to be subdued in this industry.
Valuation Based on Ore Reserves
Mineral Resources and Ore Reserves are worth considering as the long-term viability for a gold mining company is driven by how much minerals they have beneath the ground that can be extracted. Some of these underground ore may require years of development before they can be extracted. The gold price may differ significantly from the current level and its economic viability will similarly change. A company with more underground ore should naturally have a longer mine life and a greater long-term investment potential. Ore Reserves are underground ore that are currently economically viable to extract. This metric may provide an indicator of long- term investment potential as they contribute to the company’s mining life.
The figure below provides the relative valuation level for the sample companies to their historical ranges:
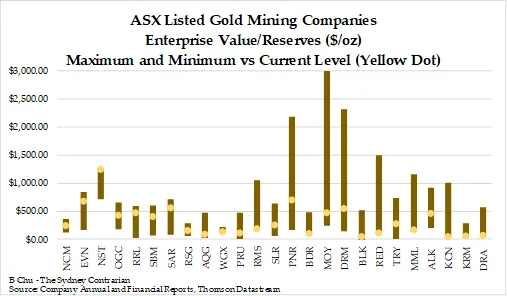
The average EV/Reserves for the sample is $322/oz. This compares to $375/oz in the previous report that contains similar companies. The valuation has fallen as a result of some companies having updated their Resources and Reserves Statement (with the majority of those who did update it having increased their reserves) as well as the gold price falling since June 2018 and hence investors have been selling down this industry.
The results here suggest that the valuation based on reserves is not associated with the category of the mining company. Most of the companies are valued between $100-400/oz reserves. However, NST, EVN, SAR, PNR and DRM are valued above $500/oz. With the exception of DRM, these companies have a higher value by merit of their strong operational performance. However, SAR and NST have less than 4Moz of reserves but they have been increasing their reserves substantially over the past six years. DRM has only 250 000oz of reserves, although it is worth noting their reserves in the Deflector mine have increased while they wrote off the reserves in the Andy Well mine. PNR has 219 000oz of reserves and is valued at over $700/oz due to a low reserve base and high gold grades that may explain a low AISC.
On the other end, KCN, BLK, KRM, DRA, AQG and BDR are valued at below $100/oz. AQG, BDR, BLK and KCN have over 1Moz reserves but only AQG is producing at relatively low cost and has stability in operational performance. The other three companies have faced high costs or, in the case of KCN, suspension of operations. KRM and DRA are micro mining companies, so their valuation by reserves is at this low level.
Within the categories, NCM appears undervalued based on its reserves base of 64.9Moz. Thus, taking into consideration the company’s high production volume and moderate AISC, the company may be worth investing given the long mining life (almost 30 years based on current production level). Among the mid-tier mining companies, WGX, PRU and RSG are trading at the lower end of the peer range. These companies all have over 7Moz, with RSG having over 14Moz. Based on their current production level, they have over 15 years of mining life. However, they are all facing operational issues and that may suggest why the market is valuing them at a low level with respect to their reserve base.
For the junior mining companies, MOY and ALK appear to be valued well above its peers, and even among the sample companies. For MOY, they currently have 304 700oz of reserves, which is 60% higher than the amount they had last year. They have been able to increase reserves, inclusive of mining depletion, at a low cost. Thus, this may explain why they enjoy a higher valuation. ALK is an interesting case in that the company’s gold reserves are running out but they have a substantial zirconium development project that they are focusing on. As a result, investors considering ALK should follow this operation instead.
When considering the EV/Reserves level with respect to the historical range, the trend is different to the other metrics as the reserves base is not associated closely with production and AISC. The companies that are worth mentioning in that their current levels are in the extremes of the historical range are NST, RMS, BDR, MOY, RED, MML, KCN and DRA.
Valuation Based on Mineral Resources
The Mineral Resources are the ore underground that are not necessarily economically viable to extract in the prevailing environment. Should the gold price increase significantly or the company has identified a more efficient method of extraction, resources may be converted into reserves. The estimation of Mineral Resources is subject to greater uncertainty than the Ore Reserves, given that it includes rocks with lower grade of ore. Thus, Mineral Resources can be arguably considered as a high risk, long-term valuation metric for gold mining companies.
The figure below shows the current EV/Mineral Resources relative to its historical range for the sample companies:
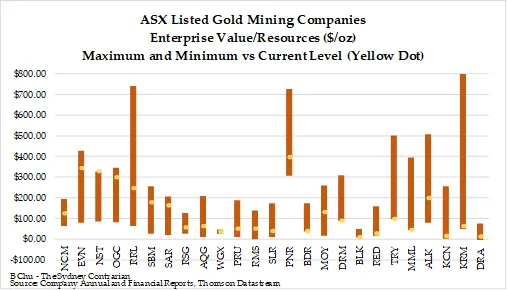
The average EV/Resources for the sample is $123/oz although 15/25 companies are trading at below $100/oz. The major and large gold mining companies generally are valued above $200/oz, with the exception of NCM. The mid-tier, junior and micro gold mining companies are generally valued at below $100/oz, although PNR and ALK are valued above its peers by a significant amount. Both PNR and ALK have below 500 000oz of resources so this explains why the valuation is high under this metric.
Among the companies that have over 10Moz of resources, namely NST, EVN, RSG and WGX, NST and EVN are valued at more than $300/oz while RSG and WGC are valued at $56/oz and $35/oz, respectively. Even when considering the operational efficiency differences between these companies, the magnitude seems to suggest that investors do not regard Mineral Resources as a significant valuation factor. For the companies with resources between 5-10Moz, namely SBM, OGC, SAR, AQG, RRL, PRU and BLK, the valuation is again diverse but is not associated with the resources base. Worthy of note is that AQG, PRU and BLK are valued at well below $100/oz, with BLK being worth as little as $9/oz resources.
Overall, the fact that many of these companies are trading at below $100/oz resources may suggest that investors believing the gold price will rise markedly in the future may be well rewarded in investing in these companies. Based on the historical range, many of the gold mining companies in this sample is trading at below the median of its historical range. Furthermore, companies in this sample are generally trading at the lowest of its historical range relative to the other metrics. The reasons for these include a low gold price meaning investors are placing little weight on valuing the companies based on resources since it is a much longer-term and higher risk metric and they prefer to invest in companies with better operations and financial position. When the gold price increases, investors may become more interested in gold mining companies with higher resources as they have a better chance of converting these into reserves and extracting them in a profitable manner.
Conclusion
This report summarises the valuation of gold mining companies listed on the ASX by considering operation and reserves/resources metrics and also shows the current valuation level relative to their historical range. The results suggest that the current period is comparable to mid-2015 when considering the prevailing gold and crude oil price as well as the relative valuation of the stronger performing gold mining companies to its weaker performing peers. The results also show that market investors prefer gold mining companies that are delivering higher production at a lower AISC, which are short-term metrics. The long-term metrics of reserves/resources appear to have less impact on the current valuation, as they do not translate into free cash flows or profits as quickly. As the gold price increases, the trend in valuation may change so that investors will place more weight on the company’s reserves/resources base and hence the potential mining life. The study shows that the company valuation process can be improved when considering AISC on top of production volume. The more efficient gold mining companies can be readily identified from the less efficient gold mining companies using this approach. An astute investor may want to select companies that deliver efficient production for short-term returns and price stability but consider also companies that have a larger reserves/resources base to take advantage of increasing gold price in the future.
Disclaimer
The author holds at least 40% of the stocks mentioned in this article, with a larger holding on the mid-tiers and juniors. The author does not receive any commission or payments from the companies mentioned.
Appendix
Research Approach
The analysis considers the valuation range of gold miners using the Enterprise Value (EV) relative to its operational results and future investment potential including Annualised Gold Production, Annualised Gold Production Adjusted for AISC, Mineral Resources and Ore Reserves. The EV is used instead of the Market Capitalisation as it considers both the equity and debt capital that the company employs to finance its business assets and would make sense from the accounting perspective.
The current level is compared against the valuation range for these four measures to allow us to determine to what extent the company is overvalued or undervalued based on its history as well as against its peers. The range is defined as the maximum and minimum EV from the later of its quarter after commercial production was achieved or 1st January 2012 to 5th September 2018. The operational results, resources and reserves corresponding to the date are based on the most recent half or full year results, annualised where appropriate. Discretion has been used in order to match the operational data with the dates of maximum and minimum EV such that it best reflects the information that investors would have used to determine the company stock price.
The current levels refer to the EV, operational results, resources and reserves as at 5th September 2018. Where possible, the most recent half and full year results are incorporated and the Ore Reserves and Resources Statement is also considered. If this is not available, the most recent information is used. The acquisition of Southern Kalgoorlie Operation by Northern Star Resources (NST) from Westgold Resources (WGX) has also been accounted for in this report, using the reserves and resources reported by Westgold.
Company Sample
25 ASX-listed gold mining companies have been selected in this study. These companies are all primarily gold producers, whereby their primary commodity being mined is gold, and have significant trading volumes on the ASX, although Oceanagold (OGC) and Alacer (AQG) have primary listing on the Toronto Stock Exchange. Furthermore, they have been in production some time during the period since 2012 but not necessarily producing as of 2012. The exception is Kingsgate Consolidated (KCN) that ceased production at the end of 2016 due to the Thai Kingdom not renewing their mining license. While Dacian Gold (DCN), Gascoyne Resources (GCY) and Tribune Resources (TBR) are also producing gold, DCN and GCY have both only commenced commercial production in the most recent financial year while TBR owns less than 50% of their producing mine. Thus, these three companies have not been included in this analysis.
Companies are divided into five broad categories (major, large, mid-tier, junior and micro) based on their annual production volume in the most recent financial year. A major mining company is defined as producing at least 1.5Moz p.a., a large mining company produces 500 000-1 500 000oz p.a., a mid-tier mining company produces 150 000-500 000oz p.a., a junior mining company produces 50 000-150 000oz p.a. and a micro mining company produces less than 50 000oz p.a. As an exception, AQG has been classified as a mid-tier rather than a junior despite their annualised production in the most recent financial year is just above 120 000oz because they have been producing at a higher capacity in the previous years and they are developing their Cǫpler Sulfide project that has substantial reserves.