Markets sell off hard as the key US Treasury 2/10 year yield curve inverts. Selling was broad based as the session unfolded. My trade action was profit taking in Swiss insurance and in gold mining and some short positioning in US retail and South Africa

Portfolio News
Market Selloff
The nerves got to the market from the European session especially when the 2/10 year yield curve spread went negative.

This inversion is an indicator for recession - not the best indicator as there can be quite a lag between the signal and the recession = last time it was around 20 months. But an indicator it is and it drives a lot of fear especially given the size of the last recession.

More concerning is the 30 year Treasury yield dropped to an all time low. Now this market action is driving yields lower and one can argue that it is doing the job for the Federal Reserve. Donald Trump continues venting about the "clueless Fed". This stuff does nothing to help market sentiment.
The timing for this selloff is not good as it is close to the end of earnings season and markets move into a period of a data vacuum until the next season begins.
Bought
Cronos Group Inc (CRON): Canadian Marijuana. Marijuana earnings season has produced strong revenue growth with disappointing earnings. This is totally normal in a growing new industry as cost growth has yet to come under strong management - focus is on revenue. Added one new stock to one portfolio to diversify holdings.
Cisco Systems, Inc (CSCO): Network Equipment. CNBC Options Action idea predicated on expectations of solid earnings. Bought a strike 55 August/September calendar call spread. This means I sold an August strike 55 call option and bought a September strike 55 call option. The idea is that price will move up to the the strike but only after first expiry (this Friday). Net premium varied dramatically across two portfolios with $0.94 paid on the first trade and $0.74 on the second trade.

Earnings came out after market close and price was smashed by 7.7% to $46.71. Earnings were solid but guidance especially from China-related business was soft. The sold calls will be safe and the bought calls have some ground to make up. The biggest factor in the earnings impact is I am short August expiry strike 50 put options. I face the choice of buying these back or buying the stock at $50 = a hard thing to do when open market price is $46.71.
Sold
European insurance has been a quiet performer against a backdrop of lacklustre European stock performance in the last 12 months. Swiss insurers have been helped in recent weeks by strengthening Swiss Franc (even though a lot of their income is not in Swiss Francs)
Zurich Insurance (ZURN.SW): Swiss Insurance. Stock price has been holding above SFr 350 for a few days. Closed a stock position for 63% profit since April 2016. Nice to see an exit before the stock falls 1.9% to SFr345.10. Closed also December 2019 strike 320 call options for 70% profit since July 2015 in another portfolio.
Swiss Re AG (SREN.SW): Swiss Insurance. With price opening at SFr98.46 I rolled up and out two contracts to December 2021 strike 100 call options to give more time and to stay out-the-money. This locked in an 18% loss on December 2019 strike 96.71 call options (since July 2015) and 7% profit on December 2020 strike 92 call options (since April 2016) for a small overall loss (SFr 70).
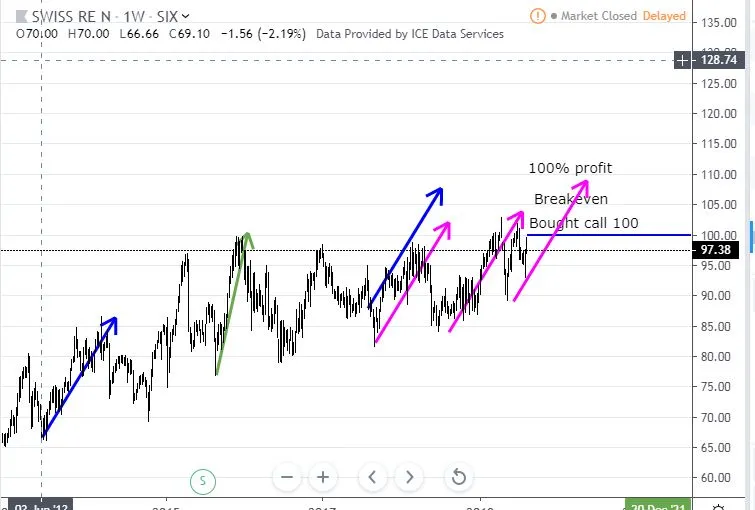
The updated chart just shows the new trade which is near the top of the range price has been trading in (I will fill in detail tomorrow). The trade is predicated on a continued series of higher highs and a hope that the cycles will eke out a few more following the pink arrows.
VanEck Vectors Gold Miners ETF (GDX): Gold Mining. Rolled up September 2019 22.5 strike call option to December 2019 strike 30 call option. Locks in 352% profit since June 2019. Price closed the day at $28.41 = a little way to go to get a profit.
Let's look at the updated chart which shows the bought call (30) as a yellow ray with expiry the dotted yellow line in the middle of the chart. Excuse the mess - I have a lot of trades open
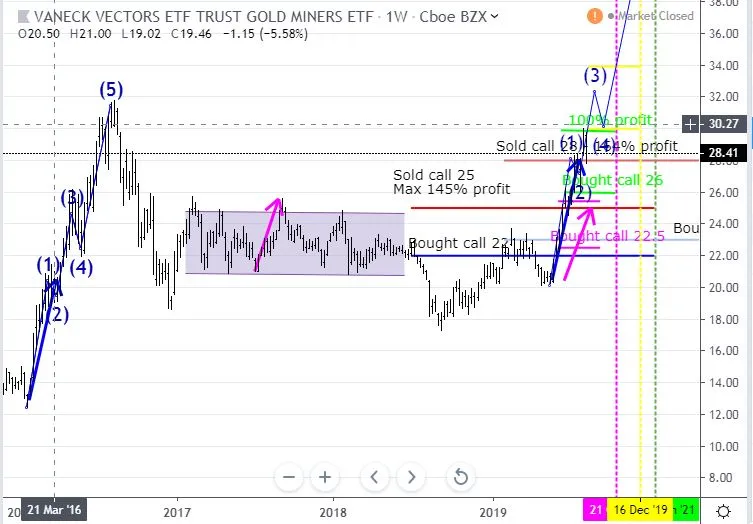
The replaced trade is the pink ray (bought call 22.5). I have cloned across the Elliot Wave to now as I can see price is now into Wave 3. There is enough time to expiry for price to correct on wave 4 and reach up towards a new Wave 5.
Shorts
Walmart Inc (WMT): US Retail. CNBC Options Action idea predicated on increasing margin pressure from major US suppliers and from projected new China tariffs. The idea was posted before the tariffs were modified. Bought an October 2019 105/95 bear put spread for a net premium of $2.42 offering maximum of 313% profit if price drops 11% from $107.21 opening price - first 1.13% came along during the day. Closing price was $106.20.
Let's look at the chart which shows the bought put (105) and 100% profit as red rays and the sold put (95) as a blue ray with the expiry date the dotted green line on the right margin.
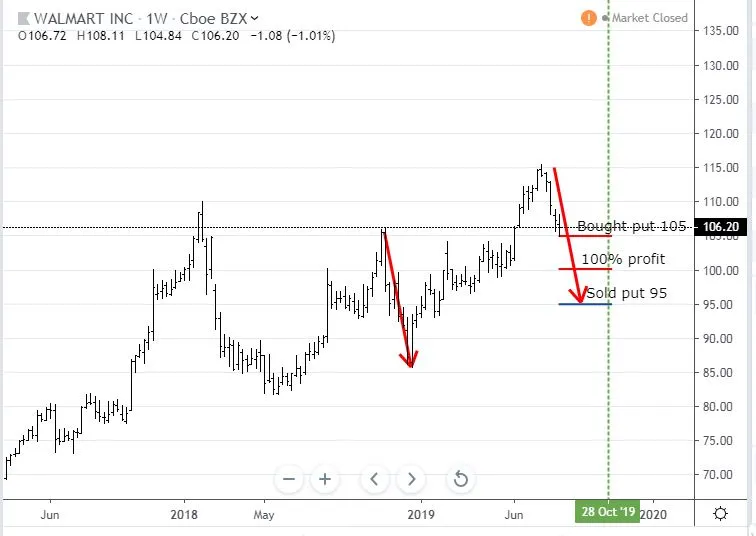
I have cloned the selloff from October 2019 highs across to now. A repeat of that and the trade makes the maximum. A drop like the early 2018 drop would be a comfortable win.
iShares MSCI South Africa ETF (EZA): South Africa Index. News flow out of South Africa remains poor. I opened a new January 2020 48/40 bear put spread for a net premium of $3.32 offering maximum of 141% profit if price drops 15% from $47.48 opening price - first 4.13% came along during the day. Closing price was $45.52
Let's look at the chart which shows the bought put (48) and the sold put (40) as pink rays with the expiry date the dotted pink line on the right margin. I have left in the trade I closed out last week as it gives context as to why I put on the new trade.
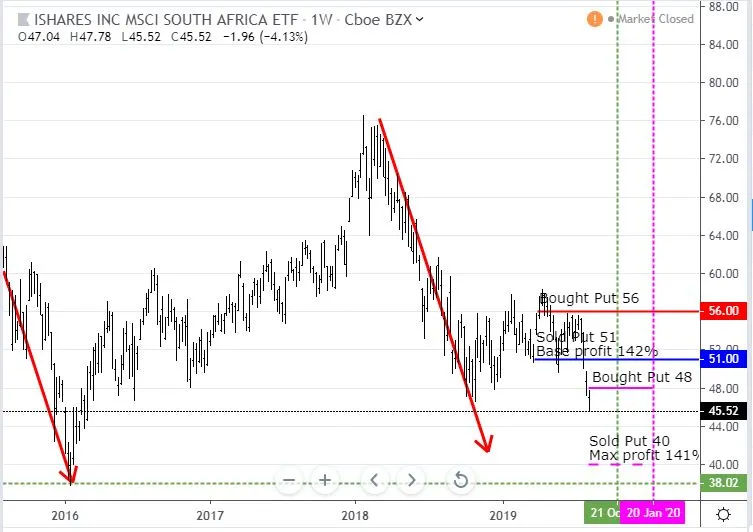
Price had been on a calamitous drop in 2018 and then consolidated for the front half of 2019 before selling off more steeply than any of the prior drops. If price plumbs down to the bottom of the red arrow price scenario that trade will get close to maximum profit. If price drops to the 2016 lows (bottom dotted green line) win will be comfortable.
Cryptocurency
Bitcoin (BTCUSD): Price range for the day was $974 (9% of the high). Price just kept following the momentum of the prior 4 days and headed down out of no-mans land to test support just below $10,000 bottoming at $9888.
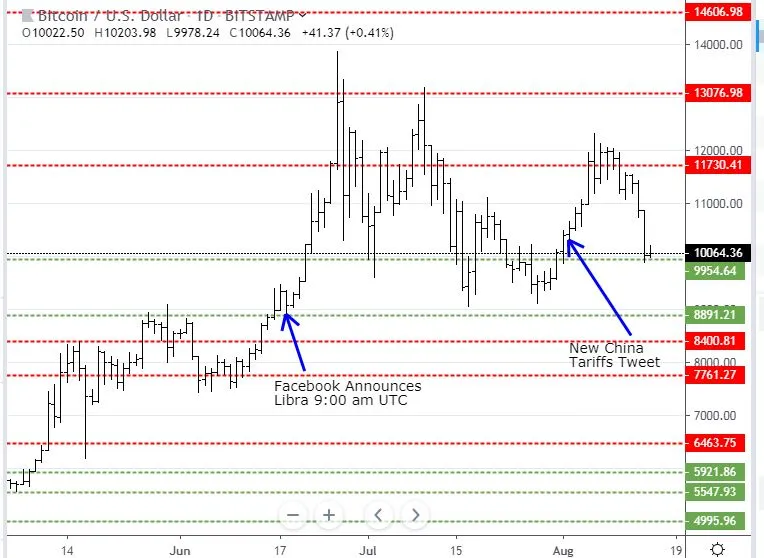
I put on one pending order in the middle of the day looking for reversals on the 4 hour chart. That order was taken in by the spread after I had trailed the entry on one bar. I hate it when that happens and price keeps falling.
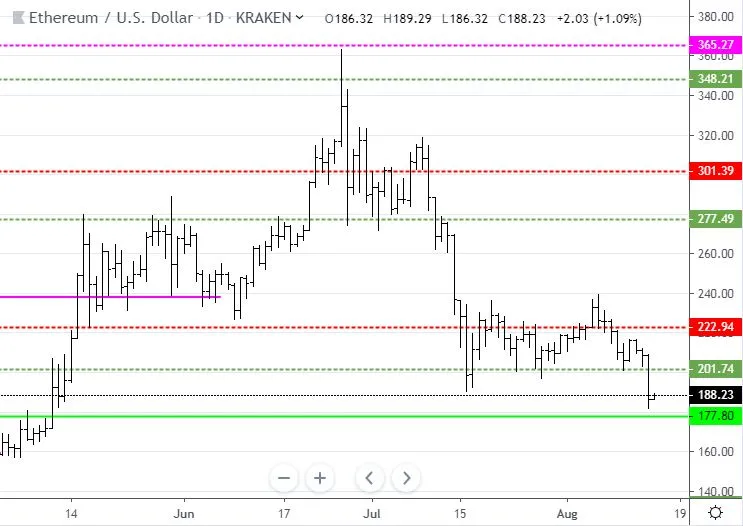
Ethereum (ETHUSD): Price range for the day was $27 (13% of the high). Price followed Bitcoin lower breaking through the $201 support level that has been holding for over a month.
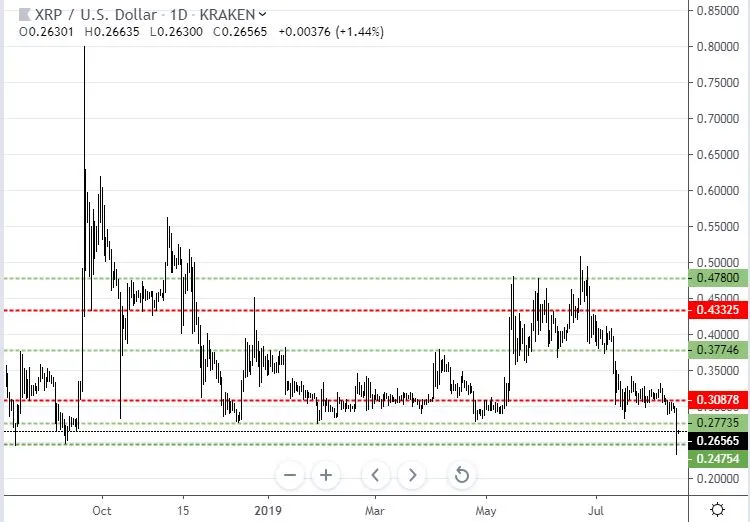
Ripple (XRPUSD): Price range for the day was $0.06390 (21% of the high). Biggest casualty of the day was Ripple with price dropping 21% from its high for the day. I did write two days ago that price breaks hard after 3 consecutive inside bars. All I got wrong was how many days it was going to take = 2 instead of 1. This tested down to levels not seen since August/September 2018 (bottom green line newly drawn in)
This move drove margin calls in my IG Markets account.
CryptoBots
Profit Trailer Bot No closed trades with Binance doing big server upgrade
New Trading Bot Trading out using Crypto Prophecy. No closed trades
Currency Trades
Outsourced MAM account Actions to Wealth closed out 4 trades on AUDNZD and GBPJPY for 0.62% profits for the day. Trades open on GBPJPY and GBPAUD (0.4% positive). At least all the GBP positions were/are short - I would not trade it long until Brexit is resolved.
Cautions: This is not financial advice. You need to consider your own financial position and take your own advice before you follow any of my ideas
Images: I own the rights to use and edit the Buy Sell image. News headlines come from Google Search. All other images are created using my various trading and charting platforms. They are all my own work
Tickers: I monitor my portfolios using Yahoo Finance. The ticker symbols used are Yahoo Finance tickers
Charts: http://mymark.mx/TradingView - this is a free charting package. I have a Pro subscription to get access to real time forex prices
August 14, 2019