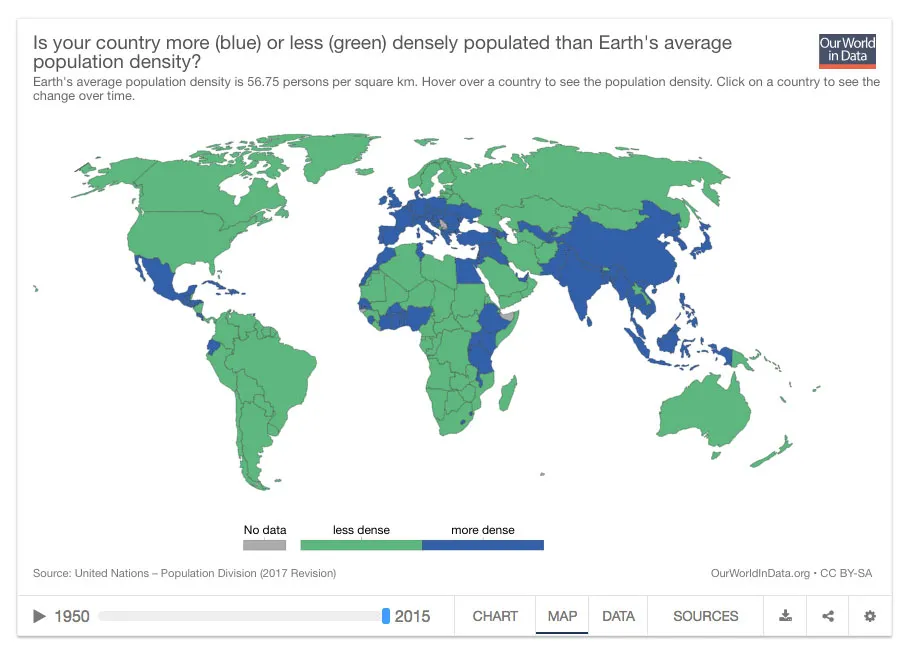
This simple interactive map of Our Wold in Data shows the world divided into two groups: those of those countries that are above the average population density (in blue) as opposed to those below: Population Division. You can move the bar to see the evolution over time.
The average density of our planet is about 56.75 people per square kilometer, resulting from dividing the 7,500 million inhabitants that populate the planet Earth between 150 million km² of land surface; the seas are not counted in this case. The data varies a bit depending on whether Antarctica is included or not, and as it says in Wikipedia actually half of the terrestrial areas are inhospitable and uninhabitable (deserts and high mountains especially) so that you could consider up to 100 a reasonable average value .
Naturally we humans huddle around rivers, areas with clean water and places where there are already more people. In Singapore or Hong Kong there are more than 6,000 people per km² (there are even 21,000 in Macao or 18,500 in Monaco, although they are small places with less than a million inhabitants). At the other end of the list - Lost type islands apart - are Greenland (0.03 people per km²), Mongolia, Namibia and Australia.

If you liked or it was useful, do not forget to follow me, leave me your vote and if you want you can buy me a beer

with this you help me a lot and I can write content of better quality in the future.