So one year has passed and this network has grown in so many ways. As an economist I am naturally drawn to topics that are related to my field of study. One such topic is the rate at which hive (the token) is creaated...otherwise known as inflation.
There are alot of posts that talk about this so I am not going to repeat (for the most part) what has already been written on the subject. Instead I want to introduce some concepts that are not known/talked about that are unique to the hive blockchain.
Before we start it must be pointed out that the real inflation rate for hive is much less predictable than other blockchains. For example bitcoin creates 6.25 coins every block and that emission rate is cut by half every four years.
Since december of 2016 the annual inflation schedule for hive was set at 9.5% which declined by ~0.42% per year. The reason for the relative unpredictability is that the percentage is based on the virtual supply and not the current supply.
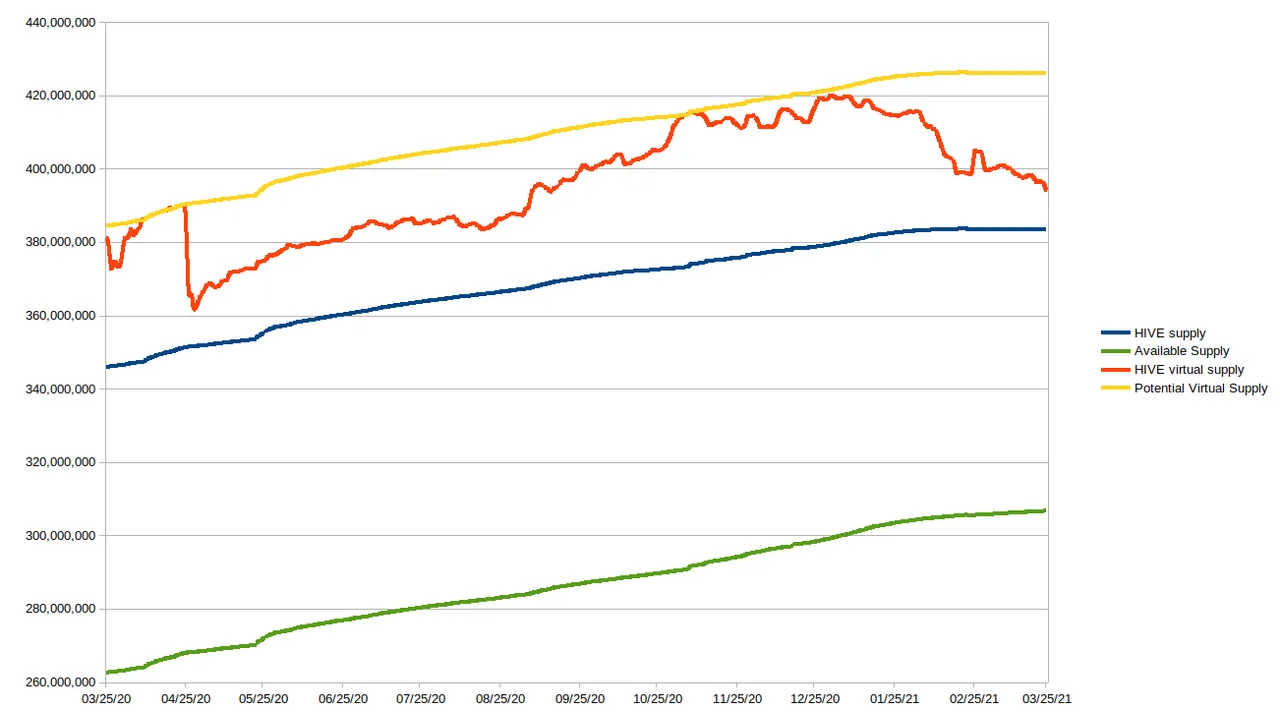
In this graph we see the evolution of the hive supply over the last year. Here is were we need to define some terms:
Hive supply is all of the coins in existence including vested and non-vested balances also known as the current supply.
Virtual supply is equal to the current supply + hbd supply divided by the median price feed. This is the supply that can come into existence if all of the hive dollars were to be converted to hive at the same time at any given point.
Potential virtual supply is the maximum amount that the virtual supply can grow at any point in time. It is equal to the current supply divided by 9 + the current supply. It can be thought of as the theoretical limit on the current supply if there is a severe decline in the price that takes the debt ratio to the limit plus the conversion of all of the hbd supply at the same time.
Available supply is equal to the current supply minus the hive balance on the DAO. It represents the supply that can actually be bought and sold.
Note: the balance in the DAO is locked and is slowly being converted to HBD and added to the treasury. Only 1% of the balance in the treasury can be used by proposals that are approved by stakeholders and only in the form of HBD. For those reasons the hive balance in the DAO is locked. Once all of the hive balance is added to the treasury (in about 5+ years) the available supply will be equal to the current supply.
Coming back to the graph it is very obvious that the virtual supply is inversely correlated to the price of hive when the debt ratio is below 10% (or in other words when there is a difference between the virtual supply and the potential virtual supply).
This coupled with the fact that the emission rate is based on the virtual supply has the side effect of more hive being produced at a slightly higher rate when the price of hive is going down relative to when it is going up...at least until the debt ratio is reached. The reverse is also true.
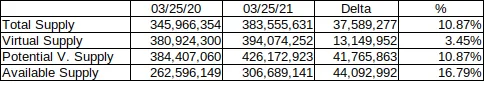
The average inflation scheduled during the last year was around 7.9% give or take. So what was the real inflation during hive's first year?
It has to be said that the major contributer to the difference between the scheduled and the real inflation is the amount of hbd converted and that this tends to happen during the periods when hive is in a bear market but I will not dive into that subject since it has been covered extensively by other members of the community.
Although I have to point out that the proposed change to the code by @blocktrades that will allow conversions from hive to hbd will introduce a key component to the tokenomics that will balance out the negative side effects of hbd conversions.
So the inflation rate of the total supply is off by ~3% but the available supply more than doubled to what was scheduled. You can guess where the difference is coming from. The inflation rate of the latter is much more relevant to everyone who is interested in the impact that it has on the future price of hive (since that figure has a higher influence on the future value for stakeholders).
Not all is bad news. Pay close attention to the numbers in the last 30 days.
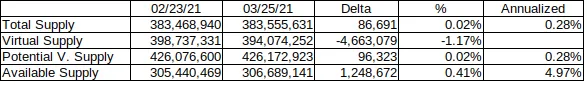
The combined effect of both the transfer of the hive DAO balance to the treasury as HBD and the hbd stabillizer effort lead by @smooth has made it possible for the effective inflation of the total supply to be near zero in the last month.
In addition the hbd stabilizer has made it possible for the available supply to increase by only 4.97% (if we make an annual projection) which is ~2.5% less than the current projected rate (7.48%).
During this post the term debt ratio has been used a couple of times. If you are unfamiliar to this I encourage you to read the post by @timcliff called Sbd Explained that dives deep in the economics of SBD (now HBD).
The economics of hive have more nuance to them than what meets the eye. In the next post I will take a look at the vested ratio, the liquid supply (not to be confused with the liquid supply shown on block explorers) and more.