The correlation coefficient indicator has been one of my favorite indicators to apply on the chart. Not because I found practical utility with it during trades but because it's nice to know how it can help support or counter my bias on the market trend in the long term.
Disclaimer: None of this is financial advise. Do your own research. Like the previous post about on chain data the thoughts shared here are explaining my bias on the current market trend for Hive and I could be wrong.
About the Indicator
Correlation coefficient is a statistical measure of the strength of a linear relationship between two variables. Its values can range from -1 to 1. A correlation coefficient of -1 describes a perfect negative, or inverse, correlation, with values in one series rising as those in the other decline, and vice versa. A coefficient of 1 shows a perfect positive correlation, or a direct relationship. A correlation coefficient of 0 means there is no linear relationship. - Investopedia
I highly suggest you read about Correlation Coefficient in depth as this post doesn't cover everything about the indicator.
My notes:
If there is a positive correlation between BTC and HIVE, when BTC goes up, Hive price follows. But it does not automatically mean BTC caused Hive price to go up.
If there is a negative correlation between BTC and HIVE, when BTC goes up, Hive goes down. But is does not automatically mean BTC movement caused the price of Hive to go down.
If there is no correlation (oscillating near zero levels or flat), both currencies will not display a consistent pattern. Correlation coefficient indicator implies either of the two variables are dependent of each other.
Correlation coefficients is used for hedging against volatility risks in Factor Investing. This is one of the many tools used to manage a portfolio. Please note that that having no, positive or negative correlation results does not automatically mean causation.
What I'm saying is, just because BTC will show a positive correlation with Hive, does not necessarily mean Hive rally to the upside is caused by BTC movement to the upside or vice versa. Random events on the market can happen where more traders are interested in trading Hive than BTC in an altcoin bullish environment.
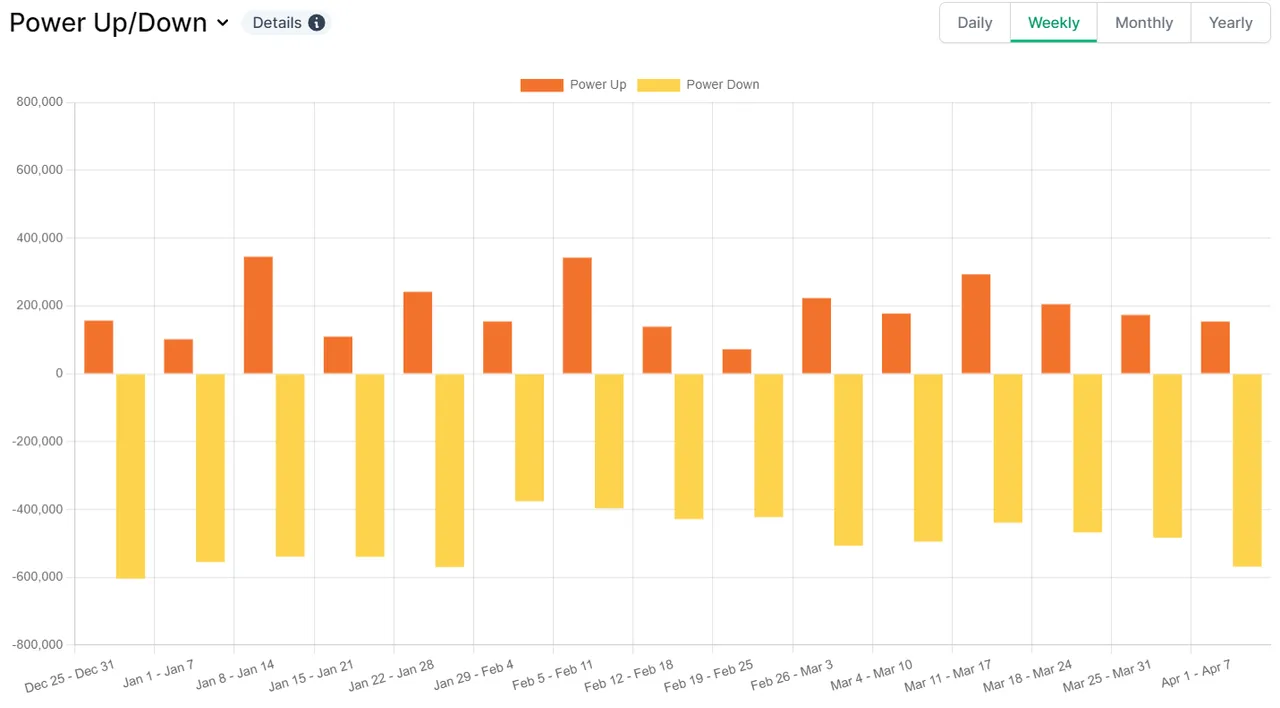
More Hive is being powered down on a weekly basis according HiveHub.dev which is a bearish sign. We need more Hive being powered up to reduce supply from circulation.
BTC is the stronger currency. This is obvious by the fact that people are dumping their Hive in exchange for it as seen below the HIVE/BTC pair taken from CoinGecko on a weekly chart:
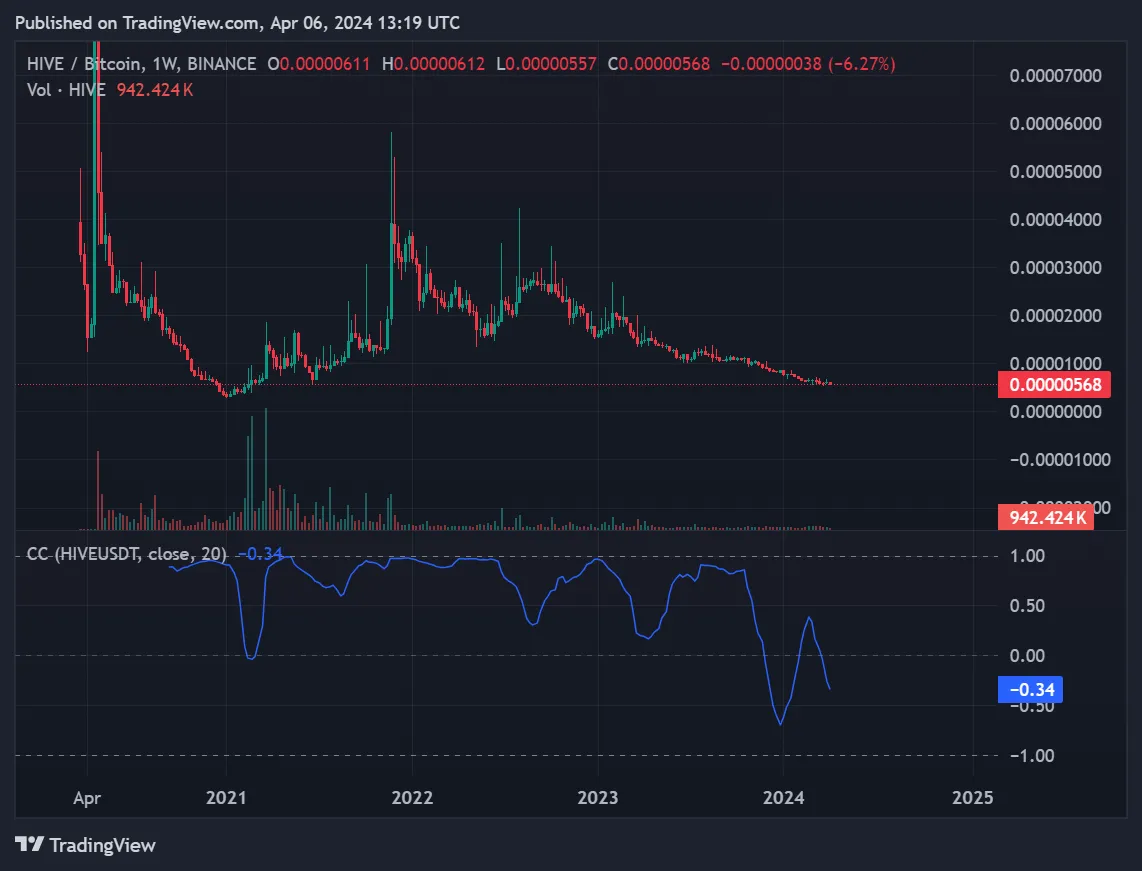
You'll see an indicator with a blue line [Hive/USDT] which I use to review the correlation coefficient showing a negative correlation. This means the stronger the negative correlation, the opposite directions these tokens move are likely to happen.
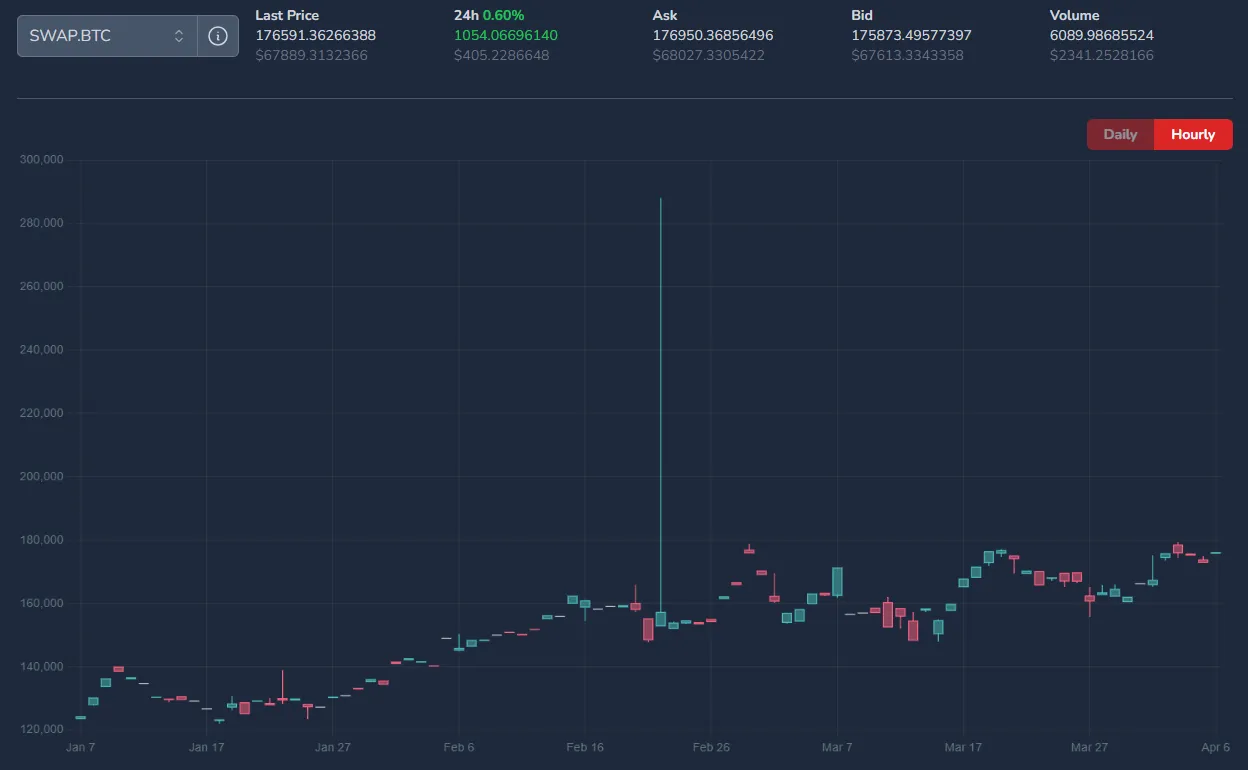
This is further supported by Hive Engine activity favoring the SWAP.BTC over SWAP.Hive over the course of 3 months.
But wait, there's more:
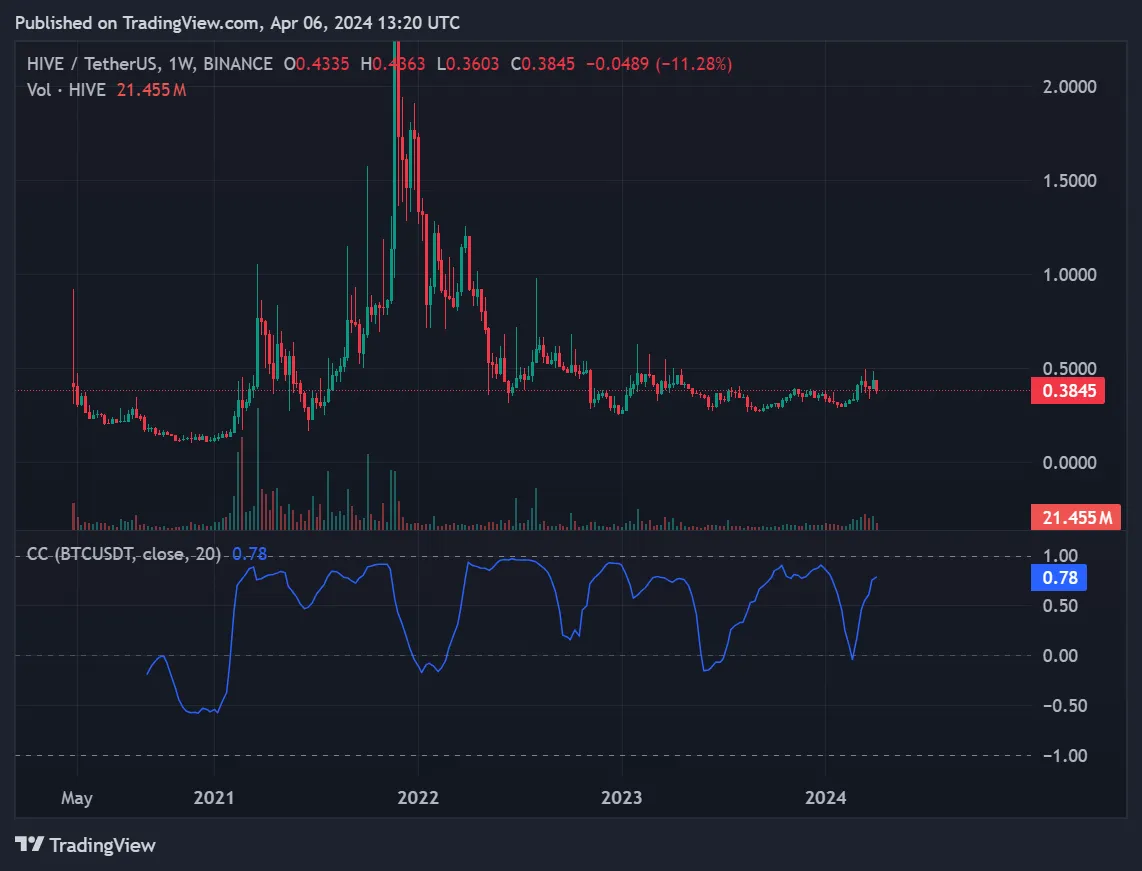
Below is a weekly chart for HIVE/USDT pair and underneath in blue line is a correlation coefficient indicator with [BTC/USDT] pair. You can see there is a positive correlation between HIVE and BTC which gives more support to the idea that when BTC rises, Hive also rises BUT it doesn't always always mean one event caused the other effect. Between these two currencies, BTC remains the dominant token and traders would opt to HODL BTC more than Hive. Now I know this sounds like it's damn obvious how BTC is the dominant token, but I like to have some foundation first before reaching that conclusion.
My thought process is, if I have a bias, I need to consider the observable things that are supportive and against that bias, weigh them in before coming to a conclusion. So currently my overall bias has been bearish for Hive and if it does make a rally towards the upside, it will entirely be dependent on how BTC performs.
While back testing on the short term, correlation coefficient is unreliable the smaller the time frame. I get a consistent picture around 4H and up time frames. It's really not meant for quick trades. Trading Hive just by looking at the Hive chart without checking what BTC is up to is like being tone deaf to the market.
Thanks for your time.