What Is A Chart Pattern? Explain with Candlestick Charts.
source
A chart pattern is a graphical view of price movement which can either be in commodities, trading, or the stock market they are mostly used for day-to-day trading activities and help traders keep track of price movement using technical analysis.
With chart patterns, traders can easily keel historical records of past events in the trading space it helps traders to plot graphs of price movement.
There are different types of a chart pattern which includes traditional chart pattern, harmonic pattern, and candlestick pattern.
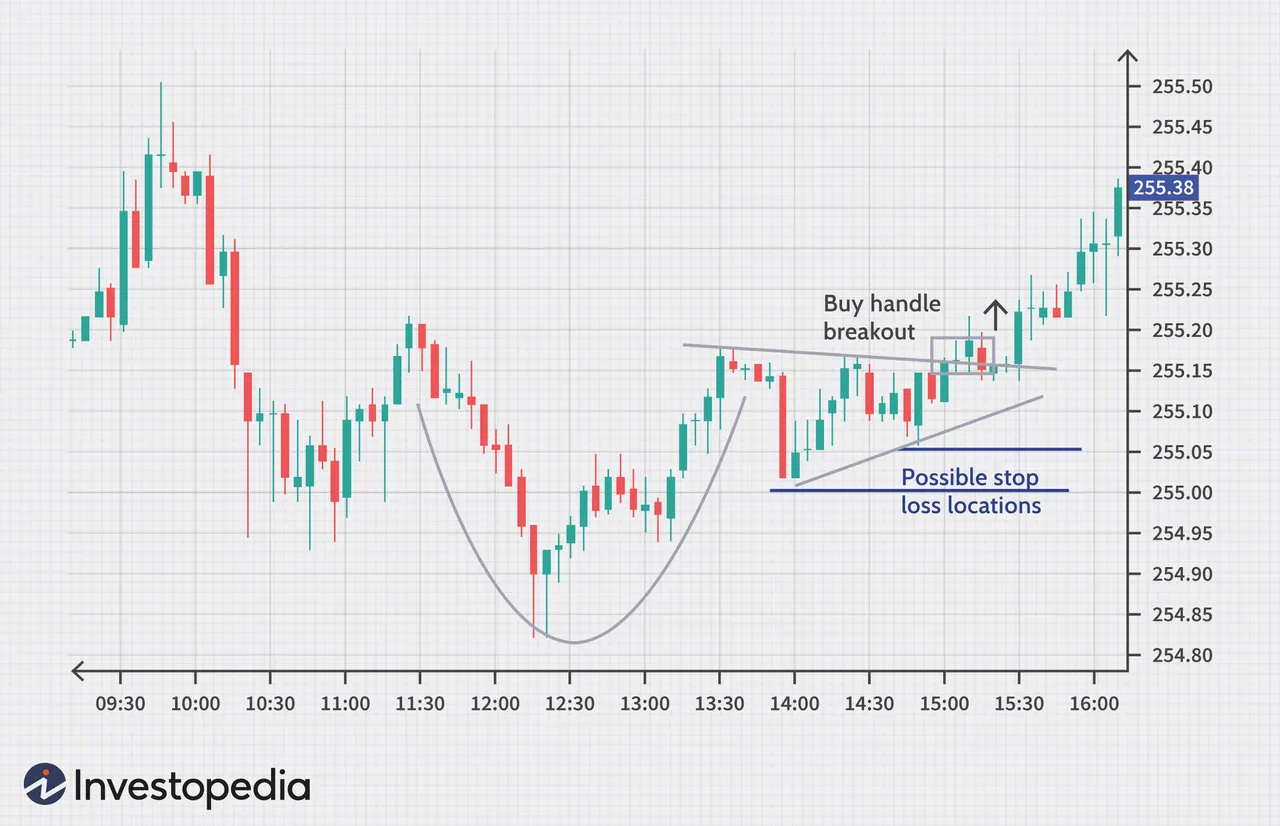
What Is A Price Breakout? Explain with Candlestick Charts and mention the price levels.
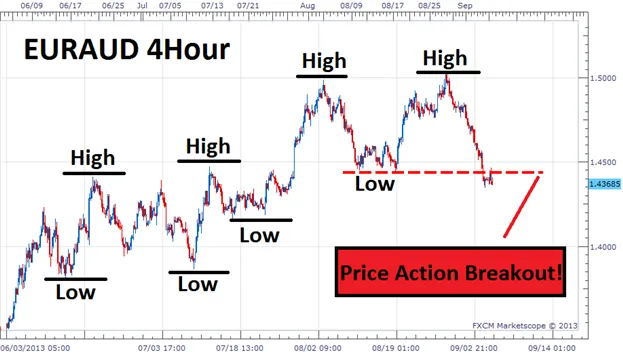
source
Price breakout in trading is a point when a specific price level is broken or breached such as when the price breach the resistance or support level.
Traders take advantage of price breakout in trading by either entering a trade when the price of a currency has reached the breakout level.
The image above is a trading pair of EUR/AUD with a 4hr trading time frame showing price breakout, showing the AUD is dominating the market and EUR is falling there is high and low showing the support and resistance there is a price breakout which is also indicated on the chart on 1.4385 level and there is a strong indication the price will go below 1.43845 level before a price reversal will occur.
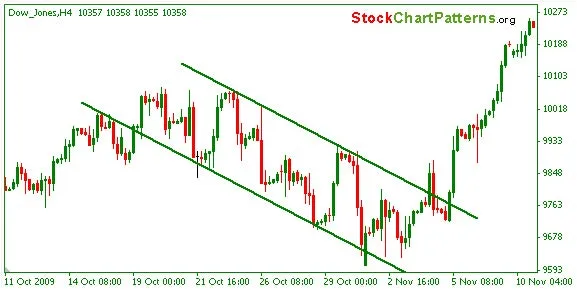
What Is A Continuation Pattern? Explain with Candlestick Charts and mention the price levels.
source
When a successful price breakout occurs there a continuation chart pattern can follow which shows there will be continuous movement of that specific currency.
Let's say there is a breakout in USD in the market of an uptrend if the movement continues we say there is a continuous price action movement.
Above is a chart pattern of a stock commodity we can see there is a bullish movement in the price showing continuous green the price level was from 9678 to 9900 which shows there is long movement in the price moving upward.
What Is A Higher High Formation? (Explain with one of the crypto coin charts where the Higher High Formation was identified.)
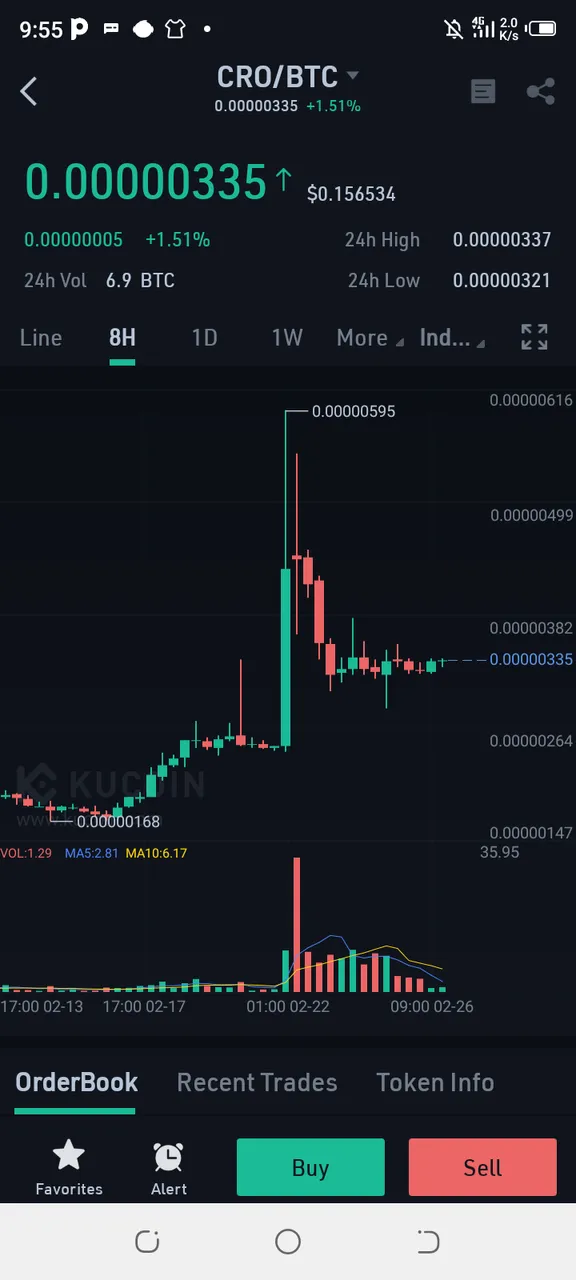
This a trading situation where are buyers dominant in the trading market. this indicates the market is moving in an upward trend and there is a strong indication the price can still be going up ans the bullish traders keep buying to dominate the market.
Above is a screenshot from my kucoin exchange showing a spot trading on CRO/BTC the green candle shows the buyers were dominating the market and the price was spiking higher high.
What Is A Lower Low Formation? (Explain with one of the crypto coin charts where the Double Top Pattern was identified.)
source
When the sellers are dominant in the market by controlling the price of which is indicated by a strong bearish we can say there is a lower low price formation in the market.
What Is A Reversal Pattern?
source
When a specific currency has crossed either the support or resistance level and has given a continuous trend with time the price of the currency will begin to fall back that process when the price begins to fall back is referred to as reversal of price.
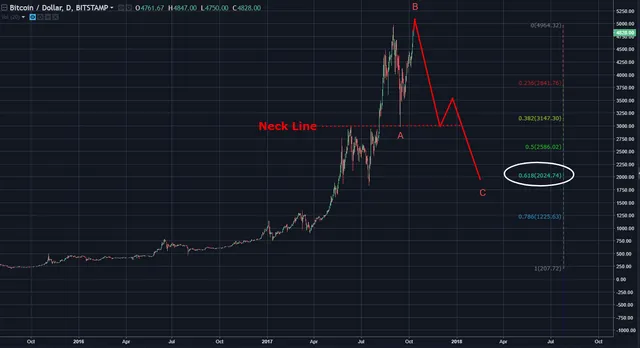
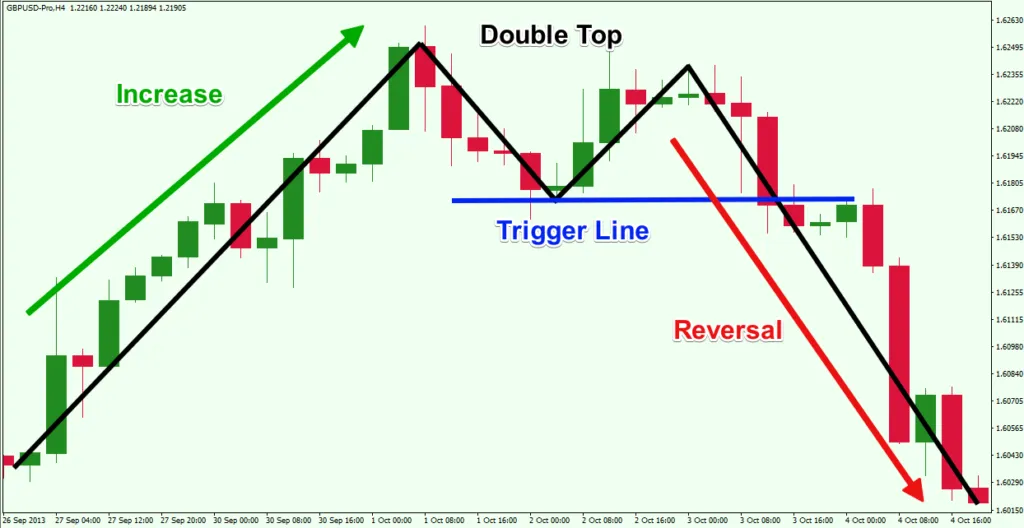
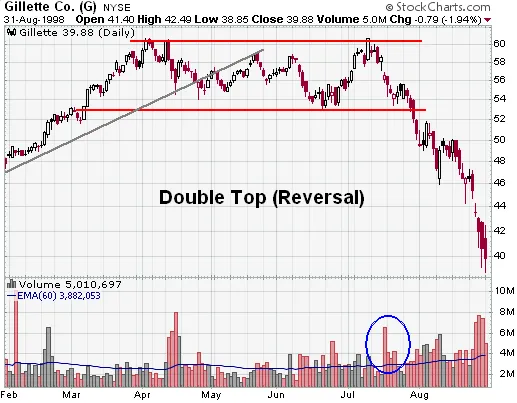
What Is A Double Top Pattern? Explain with one of the crypto coin charts where the Double Top Pattern was identified.
source
In trading, a double top pattern always indicates there will likely be a new price formation from top to bottom, always when there is an upward movement when the double top pattern is from a new reversal pattern can start with a downtrend.
Above is a BTC chart pattern showing a long uptrend after forming a double pattern that begins to move downward.
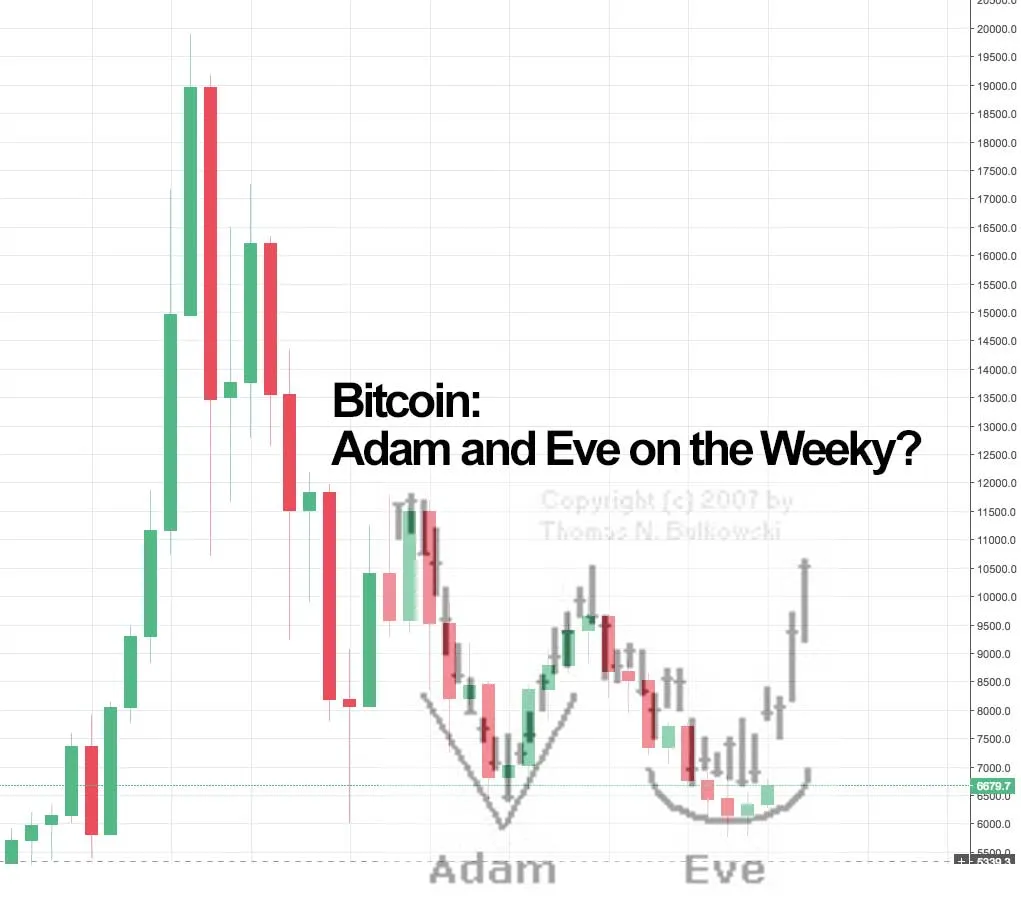
What Is A Double Bottom Pattern? (Explain with one of the crypto coin charts where the Double Bottom Pattern Was identified.)
source
It also indicates the formation of new movement it mostly shows there will be price reversal from bottom to top.
Above is the price of BTC showing a double bottom pattern with a price reversal of an uptrend.
In Investing & Trading What Is The Importance of Stop Level(STOPLOSS)?
In trading and investment stop loss is used to control risk management as a trader or investor there is a need to also have a limit of what you will lose in any trade stop loss will help prevent further loss of fund while trading.
Where To Find & How To Set A Stoploss?
When trading stop loss can be found only when a position for a particular trade is open.
let's say a position on future trading is open by a trader he can easily find stop loss depending on their exchange features stop loss is set below or above any price open position when trading.
What Understood From This Course?/ Conclusion.
In this course, I understand what chart pattern is all about and how it helps traders to make easy and convenient technical analysis with such pattern a trader can keep track of trading events and history.
Breakout is also important when trading it gives traders a clear pivotal point on when and how to enter a trading position.
Continuation pattern also helps traders to know whether a particular currency is going upward or downward.
Lower low or higher high formation of shows who are controlling the market either the buyers or sellers.
Also, there is a need to manage risk while trading with stop loss.
Thanks for stopping by.
This post was originally published by me here