Hello there. I wanted to share with you the Hive/Usdt chart that I follow up to date. The chart is four hours. I did not make any changes to the weekly and daily charts.
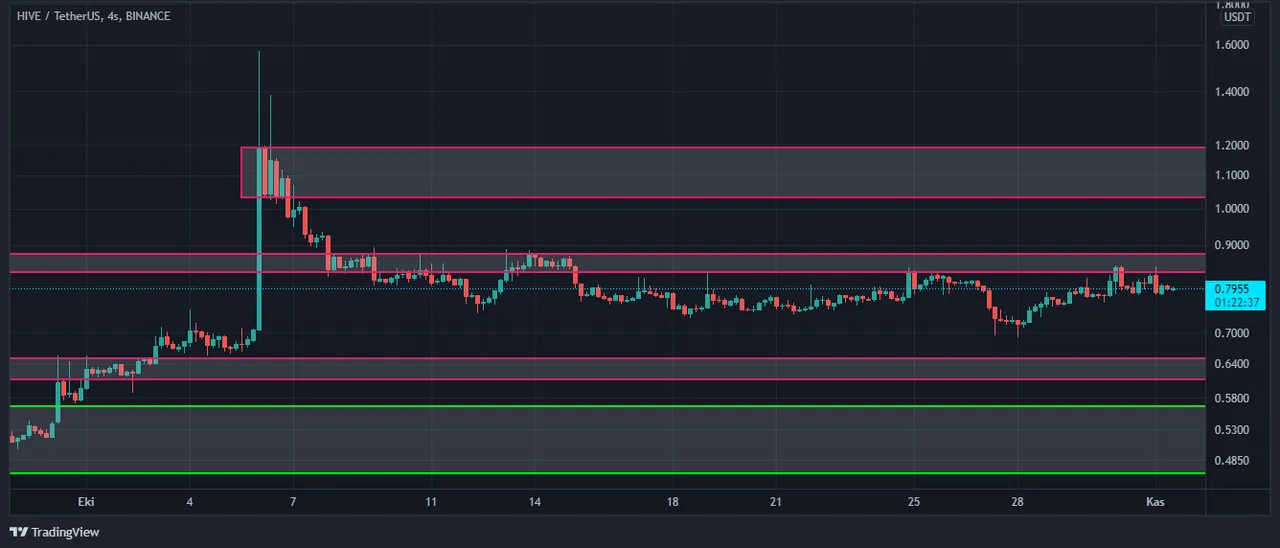
There is a resistance zone around $0.85. Below is a supply-demand zone in the $0.55-$0.65 range.
I am not an investment advisor. You should make your investment decisions yourself according to your financial and psychological state. It would be more useful to see this sharing as an educational work. See you.