Hello everyone. I published the Hive chart I was following at the beginning of February. There is no major change in my chart. However, Hive lost approximately 25% of its value during this period. I currently follow a few supply-demand regions. I wanted to share them with you. This content will be quite short. However, I will add a few more graphics as comments later.
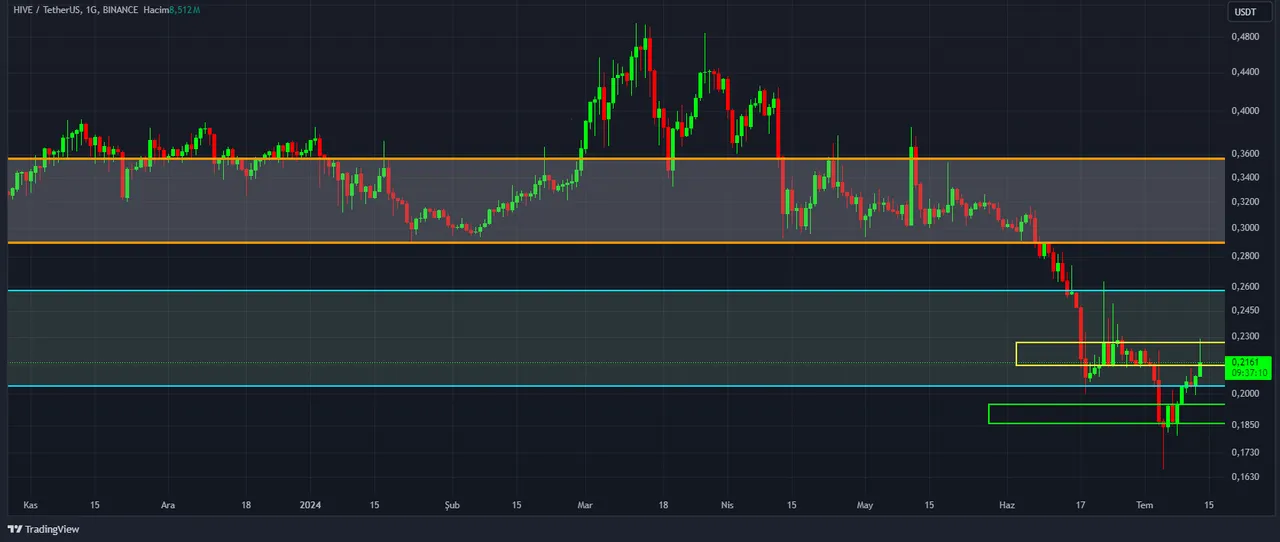
I took the above screenshot from Binance Exchange data on the Tradingview site. I follow the price on a daily basis. The wide supply-demand region where the price is located passes through the $0.2-$0.25 price range. The supply-demand zone below lies in the price range of 0.185-0.195. The supply-demand region above passes through the price range of 0.21-0.227.
This is not an investment advice. I am not an investment advisor. You should make your investment and trading decisions based on your financial and psychological situation. It would be more beneficial if you view this content as an educational study. See you again. Stay tuned.