Hi there. In this programming post, I cover the topic of obtaining Coinbase crypto price data into the R programming language. I came across a neat website called https://www.cryptodatadownload.com/data/ for obtaining free historical data online. There is no registration required and you can obtain .csv data files.
The full details of the post can be found here on my website.

The Script For Obtaining Coinbase Crypto Data
The script is from a blog post on the crypyotdownload.com website. Here is the link.
rm(list = ls())  # reset global variables
#import the libraries we need
library(jsonlite)
library(glue)

# create a function to retrieve daily data
retreive_daily_data <- function(pair, filename) {
    url = glue("https://api.pro.coinbase.com/products/{pair}/candles?granularity=86400")
    columnNames <- c('unix', 'low', 'high', 'open', 'close', glue('{pair} volume'))
    mydata <- fromJSON(url)
    df <- as.data.frame(mydata)
    colnames(df) <- columnNames  # rename the columns

    write.csv(df, file = filename)
    }


newPair <- "BTC-USD"
fileName <- glue("dailyData{newPair}.csv")
runFunc <- retreive_daily_data(newPair, filename = fileName)
runFunc
According to the link, the above script from the blog post resets global variables and imports the needed R libraries first. The function takes a crypto trading pair and a filename as inputs. The Coinbase API is called for daily granularity (granularity set at 86400 for 86400 seconds in one day) data. Columns are renamed and a .csv file is written based on the filename input.

Building Upon The Script
The provided is script is nice. One problem I saw was that what if you wanted to read the data? You would have to read the .csv file that was outputted by the function. I modified the script such that I did not need to write the script into a .csv file.
The objective I had in mind was to obtain the crypto data with the Coinbase API and then create candlestick price plots without writing into a .csv file. These steps would be done in a function.
Here is my code. The only input is a crypto trading pair.
library(tidyr)
library(dplyr)
library(ggplot2)
library(plotly)
library(jsonlite)
library(glue)

# Function Creation:
coinbase_candlestick_plot <- function(pair){

  # Obtain url given the crypto pair
  url = glue("https://api.pro.coinbase.com/products/{pair}/candles?granularity=86400")
  crypto_data <- fromJSON(url)
  df <- as.data.frame(crypto_data)

  # Renaming column names:
  columnNames <- c('unix', 'low', 'high', 'open', 'close', glue('{pair} volume'))
  colnames(df) <- columnNames

  # Change unix epoch time into date, change column names.
  df$unix <- as.POSIXct(df$unix, origin = '1970-01-01', tz = 'GMT')

  colnames(df) <- c('Date', 'Low', 'High', 'Open', 'Close', 'Volume')

  # Plotly Candlestick Chart
  df %>% plot_ly(x = ~Date, type="candlestick",
                                 open = ~Open, close = ~Close,
                                 high = ~High, low = ~Low) %>%
  layout(title = paste("Basic Candlestick Chart Of", pair, "\n"),
        xaxis = list(rangeslider = list(visible = F)),
        yaxis = list(title = paste0(pair, ' Price \n')))
}
The unix column needed work as the times needed to be changes into dates. This is done with as.POSIXct() line in the above code.
A candlestick chart is created with the use of plotly. With plotly, you can hover your mouse on the candlesticks to obtain the prices. Reference: https://plotly.com/r/candlestick-charts/

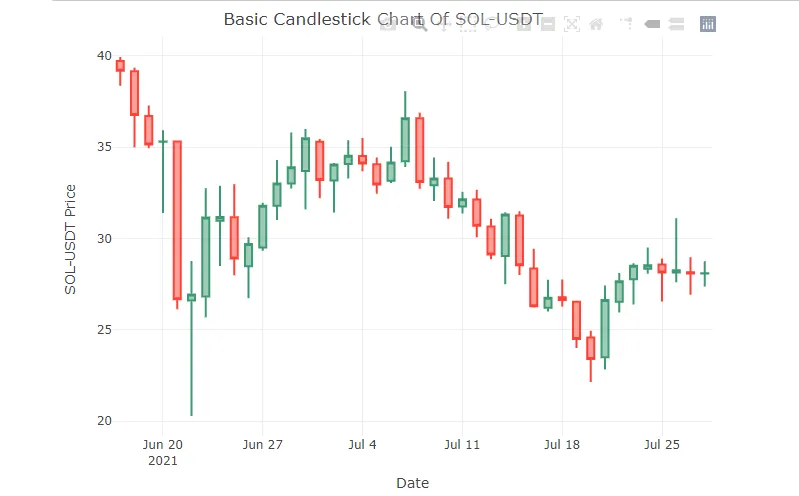
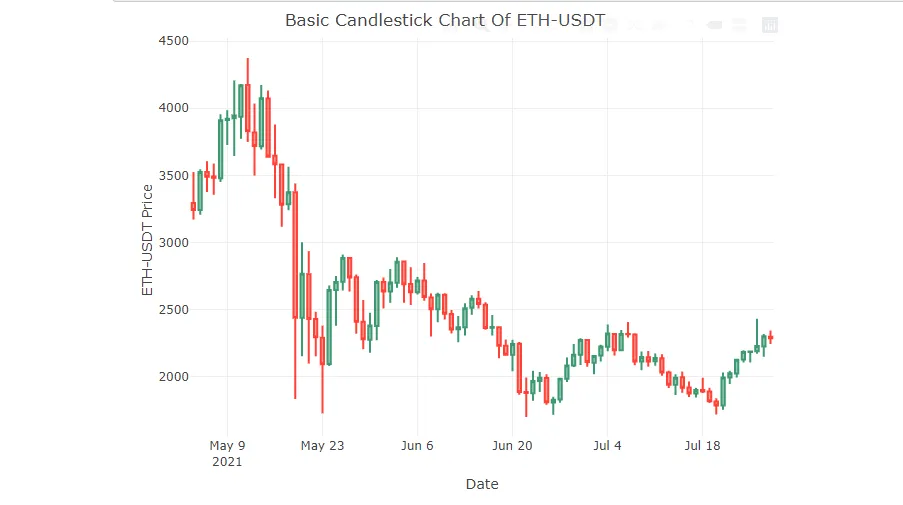
Candlestick Price Charts
After creating the function, candlestick price charts can be produced with function calls. The first function call is a candlestick price plot based on Ethereum to the Tether stablecoin. Solana to Tether is featured in the second function call.
# Function call #1 (Ethereum priced in USDT) :

coinbase_candlestick_plot("ETH-USDT")
# Function call #2 (Solana priced in USDT) :

coinbase_candlestick_plot("SOL-USDT")